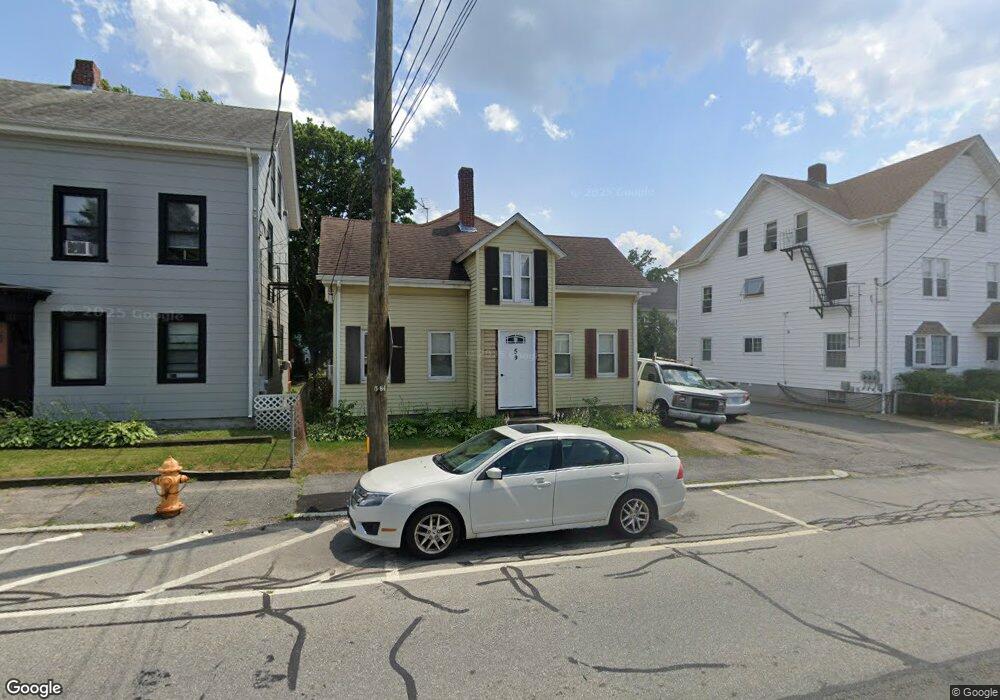
59 Dexter St Cumberland, RI 02864
Valley Falls NeighborhoodEstimated Value: $406,000 - $466,000
4
Beds
2
Baths
2,086
Sq Ft
$207/Sq Ft
Est. Value
About This Home
This home is located at 59 Dexter St, Cumberland, RI 02864 and is currently estimated at $430,851, approximately $206 per square foot. 59 Dexter St is a home located in Providence County with nearby schools including B.F. Norton Elementary School, Joseph L. McCourt Middle School, and Cumberland High School.
Ownership History
Date
Name
Owned For
Owner Type
Purchase Details
Closed on
Apr 12, 2019
Sold by
Morey Sharon R
Bought by
Morey David W and Morey Patrick G
Current Estimated Value
Purchase Details
Closed on
Mar 30, 1973
Bought by
Morey Sharon R
Create a Home Valuation Report for This Property
The Home Valuation Report is an in-depth analysis detailing your home's value as well as a comparison with similar homes in the area
Home Values in the Area
Average Home Value in this Area
Purchase History
| Date | Buyer | Sale Price | Title Company |
|---|---|---|---|
| Morey David W | -- | -- | |
| Morey Sharon R | -- | -- |
Source: Public Records
Mortgage History
| Date | Status | Borrower | Loan Amount |
|---|---|---|---|
| Previous Owner | Morey Sharon R | $97,000 | |
| Previous Owner | Morey Sharon R | $92,500 | |
| Previous Owner | Morey Sharon R | $68,000 | |
| Previous Owner | Morey Sharon R | $70,000 |
Source: Public Records
Tax History Compared to Growth
Tax History
| Year | Tax Paid | Tax Assessment Tax Assessment Total Assessment is a certain percentage of the fair market value that is determined by local assessors to be the total taxable value of land and additions on the property. | Land | Improvement |
|---|---|---|---|---|
| 2025 | $3,236 | $263,700 | $99,900 | $163,800 |
| 2024 | $3,151 | $263,700 | $99,900 | $163,800 |
| 2023 | $3,064 | $263,700 | $99,900 | $163,800 |
| 2022 | $3,068 | $204,700 | $73,300 | $131,400 |
| 2021 | $6,840 | $204,700 | $73,300 | $131,400 |
| 2020 | $6,174 | $204,700 | $73,300 | $131,400 |
| 2019 | $2,649 | $166,800 | $63,300 | $103,500 |
| 2018 | $551 | $166,800 | $63,300 | $103,500 |
| 2017 | $2,537 | $166,800 | $63,300 | $103,500 |
| 2016 | $2,530 | $148,100 | $67,000 | $81,100 |
| 2015 | $2,530 | $148,100 | $67,000 | $81,100 |
| 2014 | $5,196 | $148,100 | $67,000 | $81,100 |
| 2013 | $2,518 | $159,600 | $68,500 | $91,100 |
Source: Public Records
Map
Nearby Homes