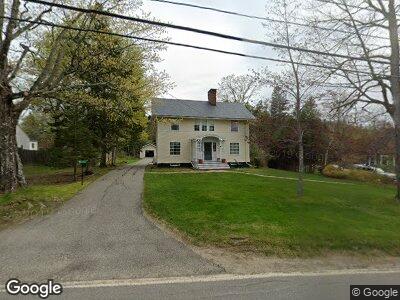
59 Elm St MacHias, ME 04654
Estimated Value: $299,000 - $476,912
5
Beds
2
Baths
2,752
Sq Ft
$149/Sq Ft
Est. Value
About This Home
This home is located at 59 Elm St, MacHias, ME 04654 and is currently estimated at $410,978, approximately $149 per square foot. 59 Elm St is a home with nearby schools including Rose M. Gaffney School, Coastal Wash Cty Inst Of Tech, and Machias Memorial High School.
Ownership History
Date
Name
Owned For
Owner Type
Purchase Details
Closed on
Dec 22, 2022
Sold by
Lambert Dale
Bought by
Ellis Daniel W and Walsh Megan
Current Estimated Value
Home Financials for this Owner
Home Financials are based on the most recent Mortgage that was taken out on this home.
Original Mortgage
$255,000
Outstanding Balance
$249,712
Interest Rate
7.08%
Mortgage Type
Purchase Money Mortgage
Estimated Equity
$188,460
Create a Home Valuation Report for This Property
The Home Valuation Report is an in-depth analysis detailing your home's value as well as a comparison with similar homes in the area
Home Values in the Area
Average Home Value in this Area
Purchase History
| Date | Buyer | Sale Price | Title Company |
|---|---|---|---|
| Ellis Daniel W | $425,000 | None Available |
Source: Public Records
Mortgage History
| Date | Status | Borrower | Loan Amount |
|---|---|---|---|
| Open | Ellis Daniel W | $255,000 | |
| Previous Owner | Lambert Dale | $254,675 | |
| Previous Owner | Lambert Dale | $250,000 | |
| Previous Owner | Lambert Dale | $201,800 | |
| Previous Owner | Lambert Dale | $194,000 |
Source: Public Records
Tax History Compared to Growth
Tax History
| Year | Tax Paid | Tax Assessment Tax Assessment Total Assessment is a certain percentage of the fair market value that is determined by local assessors to be the total taxable value of land and additions on the property. | Land | Improvement |
|---|---|---|---|---|
| 2024 | $4,744 | $321,600 | $27,800 | $293,800 |
| 2023 | $4,492 | $197,900 | $19,400 | $178,500 |
| 2022 | $4,182 | $192,700 | $19,400 | $173,300 |
| 2021 | $3,989 | $192,700 | $19,400 | $173,300 |
| 2020 | $3,989 | $192,700 | $19,400 | $173,300 |
| 2019 | $4,182 | $192,700 | $19,400 | $173,300 |
| 2018 | $4,182 | $192,700 | $19,400 | $173,300 |
| 2017 | $4,066 | $192,700 | $19,400 | $173,300 |
| 2015 | $3,916 | $192,900 | $19,400 | $173,500 |
| 2014 | $3,858 | $192,900 | $19,400 | $173,500 |
| 2013 | $3,858 | $192,900 | $19,400 | $173,500 |
Source: Public Records
Map
Nearby Homes