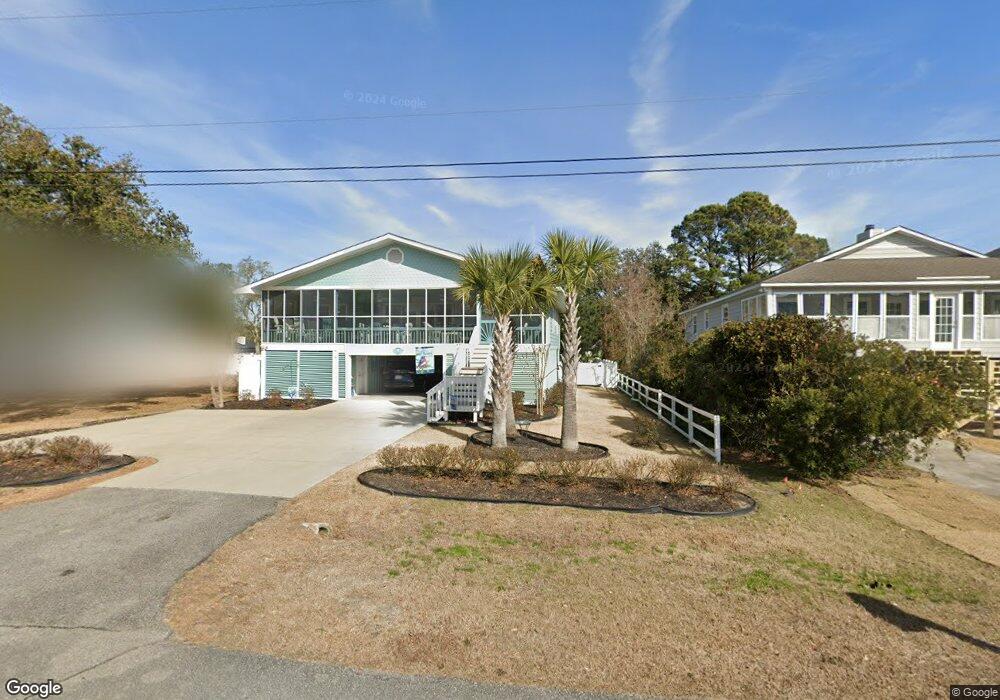
59 Eutaw Ln Unit North Litchfield Bea Pawleys Island, SC 29585
Estimated Value: $1,004,000 - $1,300,419
4
Beds
2
Baths
2,894
Sq Ft
$398/Sq Ft
Est. Value
About This Home
This home is located at 59 Eutaw Ln Unit North Litchfield Bea, Pawleys Island, SC 29585 and is currently estimated at $1,153,105, approximately $398 per square foot. 59 Eutaw Ln Unit North Litchfield Bea is a home located in Georgetown County with nearby schools including Waccamaw Elementary School, Waccamaw Intermediate School, and Waccamaw Middle School.
Ownership History
Date
Name
Owned For
Owner Type
Purchase Details
Closed on
Aug 2, 2017
Sold by
Crowe Bar Llc
Bought by
Schwartz David and Schwartz Anita
Current Estimated Value
Home Financials for this Owner
Home Financials are based on the most recent Mortgage that was taken out on this home.
Original Mortgage
$345,000
Outstanding Balance
$287,876
Interest Rate
3.96%
Mortgage Type
New Conventional
Estimated Equity
$865,229
Purchase Details
Closed on
Apr 24, 2015
Sold by
Crowe William E
Bought by
The Crowe Bar Llc
Create a Home Valuation Report for This Property
The Home Valuation Report is an in-depth analysis detailing your home's value as well as a comparison with similar homes in the area
Home Values in the Area
Average Home Value in this Area
Purchase History
| Date | Buyer | Sale Price | Title Company |
|---|---|---|---|
| Schwartz David | $525,000 | None Available | |
| The Crowe Bar Llc | -- | -- | |
| Crowe William E | -- | -- |
Source: Public Records
Mortgage History
| Date | Status | Borrower | Loan Amount |
|---|---|---|---|
| Open | Schwartz David | $345,000 |
Source: Public Records
Tax History Compared to Growth
Tax History
| Year | Tax Paid | Tax Assessment Tax Assessment Total Assessment is a certain percentage of the fair market value that is determined by local assessors to be the total taxable value of land and additions on the property. | Land | Improvement |
|---|---|---|---|---|
| 2024 | $2,881 | $24,300 | $10,000 | $14,300 |
| 2023 | $2,881 | $21,120 | $10,000 | $11,120 |
| 2022 | $2,283 | $21,120 | $10,000 | $11,120 |
| 2021 | $2,211 | $21,120 | $10,000 | $11,120 |
| 2020 | $2,205 | $21,120 | $10,000 | $11,120 |
| 2019 | $2,299 | $20,176 | $10,000 | $10,176 |
| 2018 | $6,931 | $0 | $0 | $0 |
| 2017 | $4,592 | $0 | $0 | $0 |
| 2016 | $4,564 | $21,816 | $0 | $0 |
| 2015 | $4,544 | $0 | $0 | $0 |
| 2014 | -- | $350,300 | $250,000 | $100,300 |
| 2012 | -- | $350,300 | $250,000 | $100,300 |
Source: Public Records
Map
Nearby Homes
- 186 Lakeshore Dr
- 216 Parker Dr
- 40 Seaview Loop
- 0 Jason Dr Unit known as Jason Dr. a
- 0 Jason Dr Unit 2507684
- 119 Cockle Shell Ct
- 141 Cayman Loop
- 12 Jerry Ct
- 166 Cayman Loop
- 24 Jerry Ct
- 147 Litchfield Landings Unit Lot 3 litchfield lan
- 14500 Ocean Hwy Unit Parcel B Litchfield
- 43 Sandlapper Way
- 346 Middleton Dr
- 175 Hanover St
- 73 Windover Dr
- 14290 Ocean Hwy Unit 320
- 14290 Ocean Hwy Unit 222
- 14290 Ocean Hwy
- 14290 Ocean Hwy Unit 210
- 59 Eutaw Ln
- 73 Eutaw Ln
- 85 Eutaw Ln
- 85 Eutaw Ln Unit "Coastal Getaway"
- 31 Eutaw Ln
- 60 Mulberry Ln
- 44 Mulberry Ln
- 72 Mulberry Ln
- 72 Mulberry Ln Unit North Litchfield Bea
- 97 Eutaw Ln
- 62 Eutaw Ln
- 30 Mulberry Ln
- 30 Mulberry Ln Unit North Litchfield Bea
- 48 Eutaw Ln
- 92 Lakeshore Dr
- 80 Eutaw Ln
- 84 Mulberry Ln
- 34 Eutaw Ln
- 120 Lakeshore Dr
- 111 Eutaw Ln