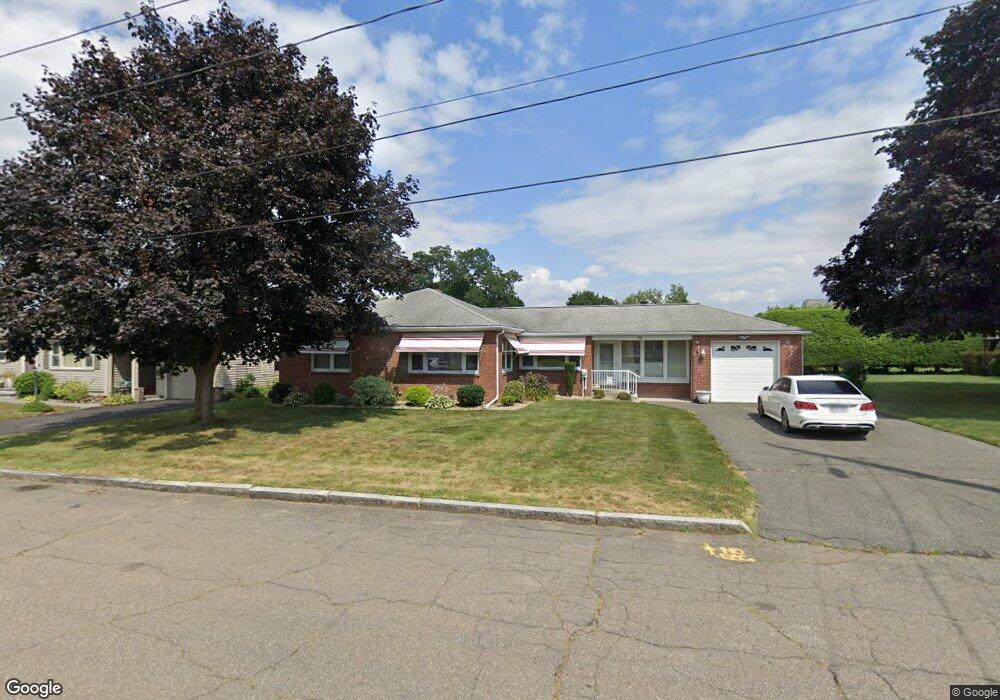
59 Francis St Chicopee, MA 01013
Chicopee Center NeighborhoodEstimated Value: $349,000 - $423,000
3
Beds
2
Baths
1,576
Sq Ft
$236/Sq Ft
Est. Value
About This Home
This home is located at 59 Francis St, Chicopee, MA 01013 and is currently estimated at $372,666, approximately $236 per square foot. 59 Francis St is a home located in Hampden County with nearby schools including Bowe Elementary School, Fairview Middle School, and Chicopee High School.
Ownership History
Date
Name
Owned For
Owner Type
Purchase Details
Closed on
Feb 28, 2014
Sold by
Gorski Eugene M and Gorski Marilyn J
Bought by
Gorski Marilyn J
Current Estimated Value
Purchase Details
Closed on
Mar 1, 1996
Sold by
Nahormek Patricia A
Bought by
Gorski Eugene M and Gorski Marilyn J
Home Financials for this Owner
Home Financials are based on the most recent Mortgage that was taken out on this home.
Original Mortgage
$70,000
Interest Rate
7.02%
Mortgage Type
Purchase Money Mortgage
Create a Home Valuation Report for This Property
The Home Valuation Report is an in-depth analysis detailing your home's value as well as a comparison with similar homes in the area
Home Values in the Area
Average Home Value in this Area
Purchase History
| Date | Buyer | Sale Price | Title Company |
|---|---|---|---|
| Gorski Marilyn J | -- | -- | |
| Gorski Eugene M | $119,900 | -- |
Source: Public Records
Mortgage History
| Date | Status | Borrower | Loan Amount |
|---|---|---|---|
| Previous Owner | Gorski Eugene M | $62,000 | |
| Previous Owner | Gorski Eugene M | $70,000 |
Source: Public Records
Tax History
| Year | Tax Paid | Tax Assessment Tax Assessment Total Assessment is a certain percentage of the fair market value that is determined by local assessors to be the total taxable value of land and additions on the property. | Land | Improvement |
|---|---|---|---|---|
| 2025 | $4,874 | $321,500 | $90,500 | $231,000 |
| 2024 | $4,617 | $312,800 | $88,700 | $224,100 |
| 2023 | $4,275 | $282,200 | $80,600 | $201,600 |
| 2022 | $4,056 | $238,700 | $70,100 | $168,600 |
| 2021 | $258 | $223,500 | $63,800 | $159,700 |
| 2020 | $3,681 | $210,800 | $63,800 | $147,000 |
| 2019 | $252 | $200,100 | $63,800 | $136,300 |
| 2018 | $107 | $191,600 | $60,700 | $130,900 |
| 2017 | $246 | $186,900 | $60,700 | $126,200 |
| 2016 | $3,177 | $187,900 | $60,700 | $127,200 |
| 2015 | $3,250 | $185,300 | $60,700 | $124,600 |
| 2014 | $1,625 | $185,300 | $60,700 | $124,600 |
Source: Public Records
Map
Nearby Homes
Your Personal Tour Guide
Ask me questions while you tour the home.