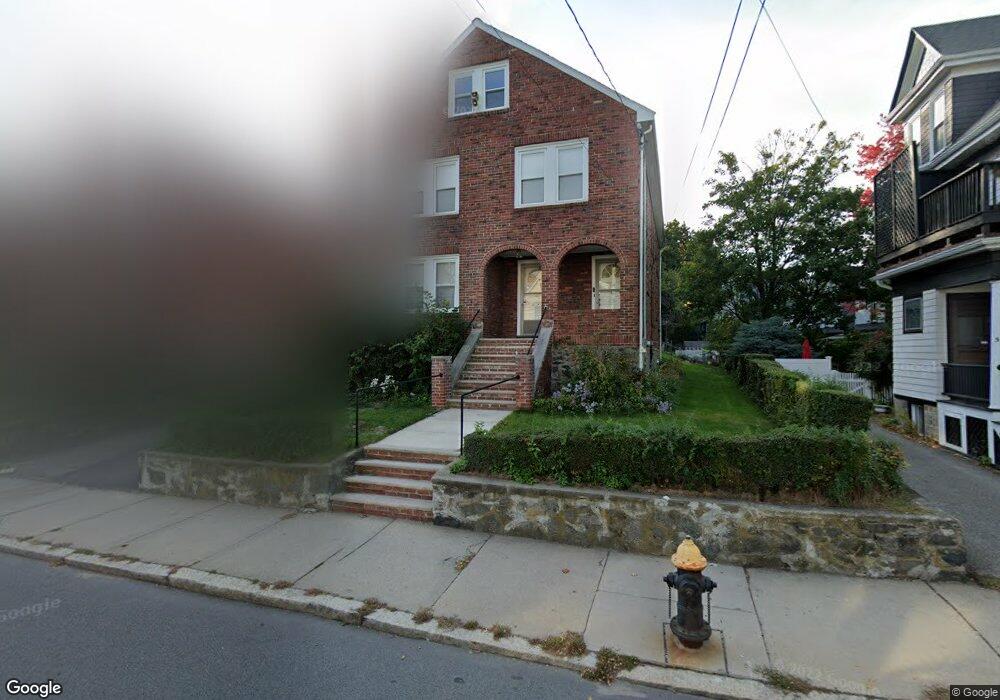
59 Gordon St Unit 59A Allston, MA 02134
Saint Elizabeths NeighborhoodEstimated Value: $1,324,545 - $1,420,000
5
Beds
2
Baths
2,622
Sq Ft
$522/Sq Ft
Est. Value
About This Home
This home is located at 59 Gordon St Unit 59A, Allston, MA 02134 and is currently estimated at $1,369,886, approximately $522 per square foot. 59 Gordon St Unit 59A is a home located in Suffolk County with nearby schools including Boston Green Academy Horace Mann Charter School, St Columbkille Partnership School, and German International School Boston.
Ownership History
Date
Name
Owned For
Owner Type
Purchase Details
Closed on
Mar 8, 2024
Sold by
Eng Wei M
Bought by
Wei Ming Eng Ret and Eng
Current Estimated Value
Purchase Details
Closed on
Aug 22, 2022
Sold by
Eng Wei M
Bought by
Eng Wei M and Eng Lenora K
Home Financials for this Owner
Home Financials are based on the most recent Mortgage that was taken out on this home.
Original Mortgage
$279,000
Interest Rate
5.51%
Mortgage Type
New Conventional
Purchase Details
Closed on
Aug 25, 2020
Sold by
Eng Wei M and Eng
Bought by
Wei Ming Eng Irt and Eng-Zerko
Purchase Details
Closed on
Mar 6, 2018
Sold by
Eng Wei M
Bought by
Wei Ming Eng Ret and Eng
Purchase Details
Closed on
Nov 21, 2016
Sold by
Eng-Zerko Lisa
Bought by
Ming-Eng Wei
Purchase Details
Closed on
Mar 1, 2007
Sold by
Wei Ming Eng Rt and Eng
Bought by
Eng Lisa S and Eng Wei M
Create a Home Valuation Report for This Property
The Home Valuation Report is an in-depth analysis detailing your home's value as well as a comparison with similar homes in the area
Home Values in the Area
Average Home Value in this Area
Purchase History
| Date | Buyer | Sale Price | Title Company |
|---|---|---|---|
| Wei Ming Eng Ret | -- | None Available | |
| Wei Ming Eng Ret | -- | None Available | |
| Eng Wei M | -- | None Available | |
| Eng Wei M | -- | None Available | |
| Wei Ming Eng Irt | -- | None Available | |
| Wei Ming Eng Irt | -- | None Available | |
| Eng Wei M | -- | None Available | |
| Wei Ming Eng Ret | -- | -- | |
| Wei Ming Eng Ret | -- | -- | |
| Wei Ming Eng Ret | -- | -- | |
| Ming-Eng Wei | -- | -- | |
| Ming-Eng Wei | -- | -- | |
| Eng Lisa S | -- | -- | |
| Eng Lisa S | -- | -- |
Source: Public Records
Mortgage History
| Date | Status | Borrower | Loan Amount |
|---|---|---|---|
| Previous Owner | Eng Wei M | $279,000 |
Source: Public Records
Tax History Compared to Growth
Tax History
| Year | Tax Paid | Tax Assessment Tax Assessment Total Assessment is a certain percentage of the fair market value that is determined by local assessors to be the total taxable value of land and additions on the property. | Land | Improvement |
|---|---|---|---|---|
| 2025 | $13,620 | $1,176,200 | $454,200 | $722,000 |
| 2024 | $12,464 | $1,143,500 | $419,300 | $724,200 |
| 2023 | $12,281 | $1,143,500 | $419,300 | $724,200 |
| 2022 | $12,441 | $1,143,500 | $419,300 | $724,200 |
| 2021 | $11,846 | $1,110,200 | $407,100 | $703,100 |
| 2020 | $11,492 | $1,088,300 | $393,700 | $694,600 |
| 2019 | $10,727 | $1,017,700 | $306,500 | $711,200 |
| 2018 | $10,058 | $959,700 | $306,500 | $653,200 |
| 2017 | $9,679 | $914,000 | $306,500 | $607,500 |
| 2016 | $8,979 | $816,300 | $306,500 | $509,800 |
| 2015 | $7,662 | $632,700 | $218,500 | $414,200 |
| 2014 | $6,895 | $548,100 | $218,500 | $329,600 |
Source: Public Records
Map
Nearby Homes
- 1419 Commonwealth Ave Unit 503
- 533 Cambridge St Unit 105
- 610 Cambridge St
- 581 Cambridge St
- 1408 Commonwealth Ave Unit 20
- 130 Glenville Ave
- 147 Kelton St Unit 305
- 159-161 Allston
- 20 Radcliffe Rd Unit 209
- 20 Radcliffe Rd Unit 112
- 15 N Beacon St Unit 328
- 15 N Beacon St Unit 412
- 15 N Beacon St Unit L01
- 15 N Beacon St Unit 401
- 86 Glenville Ave Unit 2
- 83 Glenville Ave
- 14 Radcliffe Rd Unit 1
- 53 Quint Ave
- 198 Allston St Unit 3
- 1515 Commonwealth Ave Unit 405
- 59 Gordon St Unit 7B
- 59 Gordon St Unit 9
- 61-63 Gordon St Unit 2
- 61-63 Gordon St Unit 1
- 61 Gordon St Unit 63
- 63 Gordon St Unit 10-3K
- 63 Gordon St Unit 10-1J
- 63 Gordon St Unit 10-6E
- 63 Gordon St Unit 10-2H
- 63 Gordon St Unit 10-5L
- 63 Gordon St Unit 10-3G
- 61 Gordon St Unit 2
- 63 Gordon St Unit 15
- 61 Gordon St Unit 5
- 61 Gordon St Unit 3
- 63 Gordon St Unit 2
- 63 Gordon St
- 61 Gordon St
- 61 Gordon St Unit 1
- 63 Gordon St Unit 3