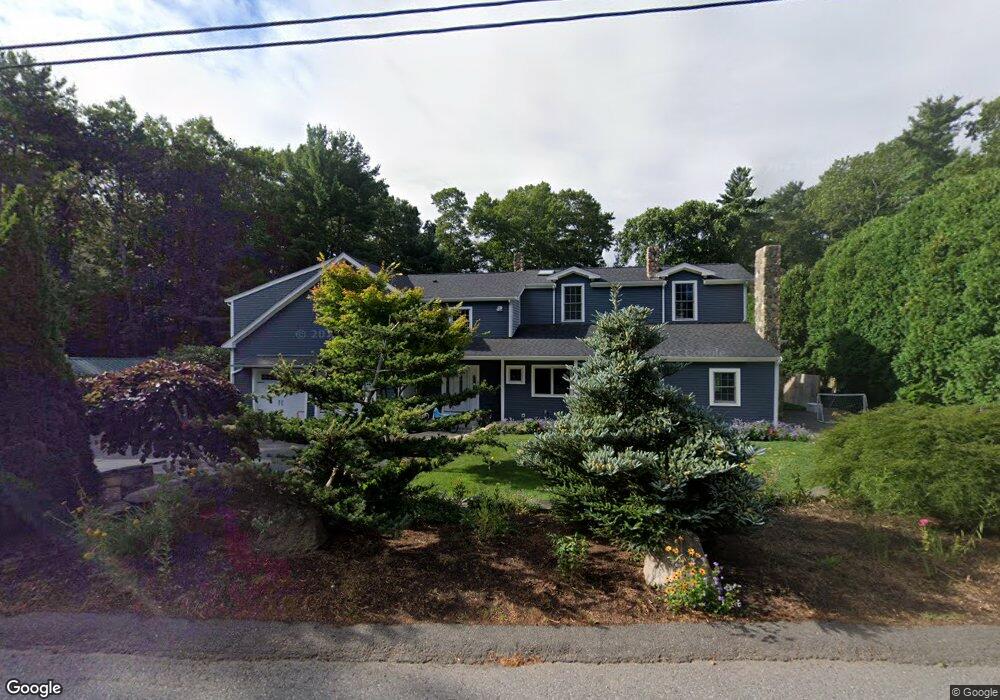
59 Gorham Ave Pembroke, MA 02359
Estimated Value: $650,000 - $964,000
3
Beds
4
Baths
2,951
Sq Ft
$288/Sq Ft
Est. Value
About This Home
This home is located at 59 Gorham Ave, Pembroke, MA 02359 and is currently estimated at $848,835, approximately $287 per square foot. 59 Gorham Ave is a home located in Plymouth County with nearby schools including Pembroke High School.
Ownership History
Date
Name
Owned For
Owner Type
Purchase Details
Closed on
Aug 17, 2011
Sold by
Sesnewicz Brett M
Bought by
Sesnewicz Brett M and Sesnewicz Kristin L
Current Estimated Value
Home Financials for this Owner
Home Financials are based on the most recent Mortgage that was taken out on this home.
Original Mortgage
$282,000
Outstanding Balance
$195,707
Interest Rate
4.62%
Mortgage Type
Purchase Money Mortgage
Estimated Equity
$653,128
Purchase Details
Closed on
Apr 30, 2004
Sold by
Murphy Laura J
Bought by
Sesnewicz Brett M
Create a Home Valuation Report for This Property
The Home Valuation Report is an in-depth analysis detailing your home's value as well as a comparison with similar homes in the area
Home Values in the Area
Average Home Value in this Area
Purchase History
| Date | Buyer | Sale Price | Title Company |
|---|---|---|---|
| Sesnewicz Brett M | -- | -- | |
| Sesnewicz Brett M | $265,000 | -- |
Source: Public Records
Mortgage History
| Date | Status | Borrower | Loan Amount |
|---|---|---|---|
| Open | Sesnewicz Brett M | $282,000 | |
| Previous Owner | Sesnewicz Brett M | $235,200 |
Source: Public Records
Tax History Compared to Growth
Tax History
| Year | Tax Paid | Tax Assessment Tax Assessment Total Assessment is a certain percentage of the fair market value that is determined by local assessors to be the total taxable value of land and additions on the property. | Land | Improvement |
|---|---|---|---|---|
| 2025 | $8,883 | $739,000 | $264,900 | $474,100 |
| 2024 | $8,686 | $722,000 | $250,400 | $471,600 |
| 2023 | $8,442 | $663,700 | $250,400 | $413,300 |
| 2022 | $8,114 | $573,400 | $204,900 | $368,500 |
| 2021 | $6,618 | $453,900 | $195,500 | $258,400 |
| 2020 | $5,951 | $410,700 | $186,700 | $224,000 |
| 2019 | $5,436 | $372,300 | $182,000 | $190,300 |
| 2018 | $5,115 | $343,500 | $165,200 | $178,300 |
| 2017 | $5,037 | $333,600 | $156,300 | $177,300 |
| 2016 | $4,937 | $323,500 | $147,400 | $176,100 |
| 2015 | $4,586 | $311,100 | $133,800 | $177,300 |
Source: Public Records
Map
Nearby Homes