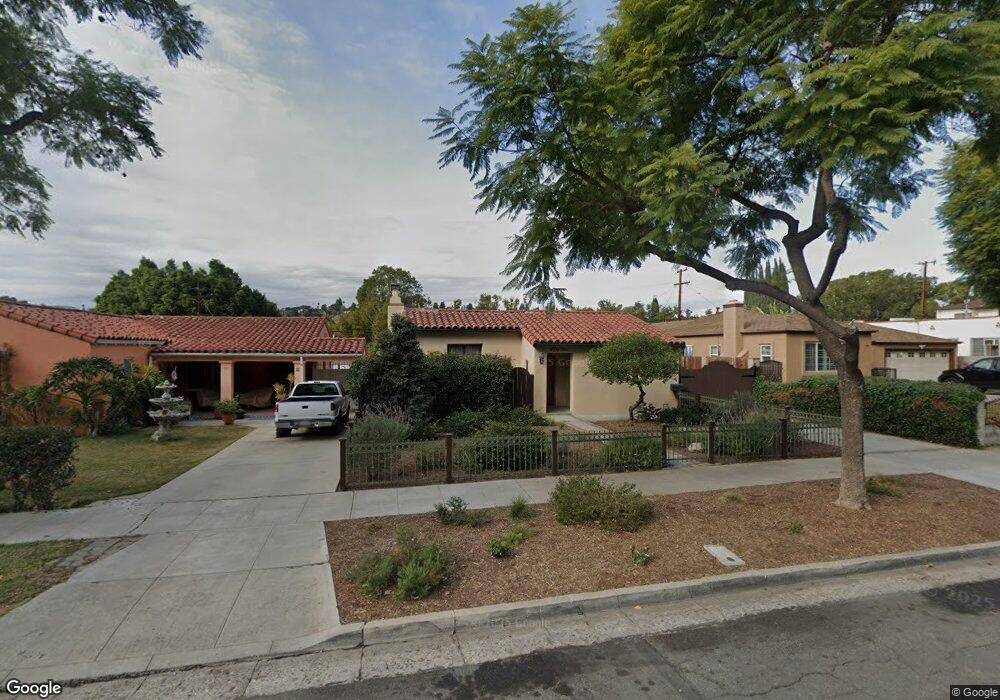
59 Hampden Terrace Alhambra, CA 91801
Emery Park NeighborhoodEstimated Value: $949,000 - $1,037,000
2
Beds
2
Baths
1,436
Sq Ft
$679/Sq Ft
Est. Value
About This Home
This home is located at 59 Hampden Terrace, Alhambra, CA 91801 and is currently estimated at $974,485, approximately $678 per square foot. 59 Hampden Terrace is a home located in Los Angeles County with nearby schools including Emery Park Elementary School, Alhambra High School, and Bell Tower School.
Ownership History
Date
Name
Owned For
Owner Type
Purchase Details
Closed on
Jul 5, 2012
Sold by
Vander Zaag Cheryl
Bought by
Vander Zaag Cheryl
Current Estimated Value
Home Financials for this Owner
Home Financials are based on the most recent Mortgage that was taken out on this home.
Original Mortgage
$201,500
Outstanding Balance
$139,290
Interest Rate
3.7%
Mortgage Type
New Conventional
Estimated Equity
$835,195
Purchase Details
Closed on
Sep 4, 2001
Sold by
Calkins John L and Calkins Guadalupe
Bought by
Zaag Cheryl Vander
Home Financials for this Owner
Home Financials are based on the most recent Mortgage that was taken out on this home.
Original Mortgage
$226,400
Interest Rate
6.73%
Purchase Details
Closed on
May 26, 1994
Sold by
Chin Ken C and Chin June S
Bought by
Calkins John L
Home Financials for this Owner
Home Financials are based on the most recent Mortgage that was taken out on this home.
Original Mortgage
$171,000
Interest Rate
8.53%
Create a Home Valuation Report for This Property
The Home Valuation Report is an in-depth analysis detailing your home's value as well as a comparison with similar homes in the area
Home Values in the Area
Average Home Value in this Area
Purchase History
| Date | Buyer | Sale Price | Title Company |
|---|---|---|---|
| Vander Zaag Cheryl | -- | Lawyers Title Co | |
| Vander Zaag Cheryl | -- | Lawyers Title Co | |
| Zaag Cheryl Vander | $283,000 | Equity Title | |
| Calkins John L | $180,000 | Title Land Company Inc |
Source: Public Records
Mortgage History
| Date | Status | Borrower | Loan Amount |
|---|---|---|---|
| Open | Vander Zaag Cheryl | $201,500 | |
| Previous Owner | Zaag Cheryl Vander | $226,400 | |
| Previous Owner | Calkins John L | $171,000 | |
| Closed | Zaag Cheryl Vander | $28,300 |
Source: Public Records
Tax History Compared to Growth
Tax History
| Year | Tax Paid | Tax Assessment Tax Assessment Total Assessment is a certain percentage of the fair market value that is determined by local assessors to be the total taxable value of land and additions on the property. | Land | Improvement |
|---|---|---|---|---|
| 2025 | $5,226 | $418,051 | $292,494 | $125,557 |
| 2024 | $5,226 | $409,855 | $286,759 | $123,096 |
| 2023 | $5,184 | $401,820 | $281,137 | $120,683 |
| 2022 | $4,935 | $393,942 | $275,625 | $118,317 |
| 2021 | $4,880 | $386,219 | $270,221 | $115,998 |
| 2019 | $4,710 | $374,765 | $262,207 | $112,558 |
| 2018 | $4,663 | $367,417 | $257,066 | $110,351 |
| 2016 | $4,286 | $353,152 | $247,085 | $106,067 |
| 2015 | $4,221 | $347,848 | $243,374 | $104,474 |
| 2014 | $4,170 | $341,035 | $238,607 | $102,428 |
Source: Public Records
Map
Nearby Homes
- 3949 Stockbridge Ave
- 4211 Lowell Ave
- 2616 W Grand Ave Unit C
- 2620 W Grand Ave Unit E
- 5390 Huntington Dr S
- 4343 Stillwell Ave
- 4536 Maycrest Ave
- 601 Orange Grove Ave
- 4200 Barrett Rd
- 2400 W Main St
- 5301 Huntington Dr N
- 5262 Remstoy Dr
- 5336 Huntington Dr S
- 5350 Oakland St
- 3908 Edison Walk
- 657 S Meridian Ave
- 5219 Lathrop St
- 208 La France Ave
- 5148 Wadena St
- 2115 Vine St
- 63 Hampden Terrace
- 53 Hampden Terrace
- 71 Hampden Terrace
- 51 Hampden Terrace
- 3104 Sherwood Ave
- 3106 Sherwood Ave
- 3100 Sherwood Ave
- 73 Hampden Terrace
- 3112 Sherwood Ave
- 47 Hampden Terrace
- 3022 Sherwood Ave
- 62 Hampden Terrace
- 56 Hampden Terrace
- 66 Hampden Terrace
- 3116 Sherwood Ave
- 58 Hampden Terrace
- 3018 Sherwood Ave
- 79 Hampden Terrace
- 72 Hampden Terrace
- 50 Hampden Terrace