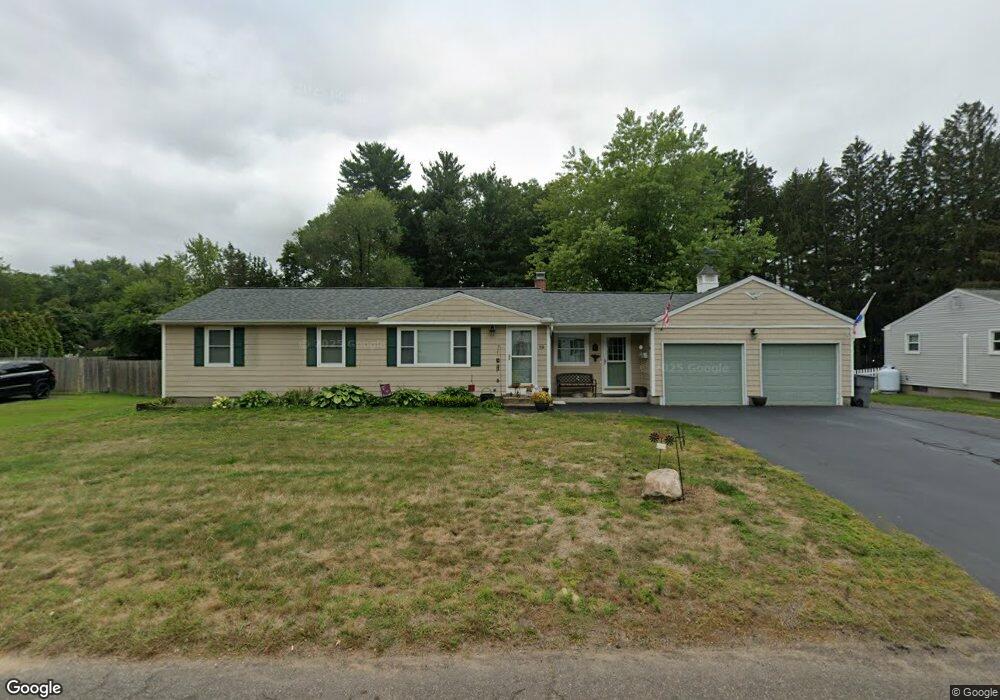
59 Indian Run Enfield, CT 06082
Estimated Value: $264,000 - $318,027
3
Beds
1
Bath
1,228
Sq Ft
$244/Sq Ft
Est. Value
About This Home
This home is located at 59 Indian Run, Enfield, CT 06082 and is currently estimated at $299,257, approximately $243 per square foot. 59 Indian Run is a home located in Hartford County with nearby schools including Eli Whitney Elementary School, Hazardville Memorial Elementary School, and John F. Kennedy Middle School.
Ownership History
Date
Name
Owned For
Owner Type
Purchase Details
Closed on
Mar 10, 2009
Sold by
Deutsche Bank Natl T C
Bought by
Arcouette Michael
Current Estimated Value
Purchase Details
Closed on
Feb 19, 2009
Sold by
Duncan Dawn
Bought by
Lasalle Bank Na
Purchase Details
Closed on
Sep 5, 2006
Sold by
Cooley Judy and Duncan Dawn
Bought by
Duncan Dawn and Ellsworth Thomas
Purchase Details
Closed on
Jul 17, 1992
Sold by
Burke Stephen and Burke Beverly
Bought by
Cooley Alan and Cooley Judy
Create a Home Valuation Report for This Property
The Home Valuation Report is an in-depth analysis detailing your home's value as well as a comparison with similar homes in the area
Home Values in the Area
Average Home Value in this Area
Purchase History
| Date | Buyer | Sale Price | Title Company |
|---|---|---|---|
| Arcouette Michael | $125,000 | -- | |
| Lasalle Bank Na | -- | -- | |
| Duncan Dawn | $145,000 | -- | |
| Cooley Alan | $125,000 | -- |
Source: Public Records
Mortgage History
| Date | Status | Borrower | Loan Amount |
|---|---|---|---|
| Previous Owner | Cooley Alan | $61,000 | |
| Previous Owner | Cooley Alan | $72,000 |
Source: Public Records
Tax History Compared to Growth
Tax History
| Year | Tax Paid | Tax Assessment Tax Assessment Total Assessment is a certain percentage of the fair market value that is determined by local assessors to be the total taxable value of land and additions on the property. | Land | Improvement |
|---|---|---|---|---|
| 2025 | $5,770 | $164,400 | $61,200 | $103,200 |
| 2024 | $5,528 | $163,500 | $61,200 | $102,300 |
| 2023 | $5,487 | $163,500 | $61,200 | $102,300 |
| 2022 | $5,051 | $163,500 | $61,200 | $102,300 |
| 2021 | $4,800 | $127,770 | $50,720 | $77,050 |
| 2020 | $4,768 | $127,770 | $50,720 | $77,050 |
| 2019 | $4,762 | $127,770 | $50,720 | $77,050 |
| 2018 | $4,634 | $127,770 | $50,720 | $77,050 |
| 2017 | $4,354 | $127,770 | $50,720 | $77,050 |
| 2016 | $4,244 | $127,220 | $52,050 | $75,170 |
| 2015 | $4,114 | $127,220 | $52,050 | $75,170 |
| 2014 | $4,011 | $127,220 | $52,050 | $75,170 |
Source: Public Records
Map
Nearby Homes
- 10-1/2 South Rd
- 23 Clear St
- 46 Beech Rd
- 84 Raffia Rd
- 30 David St
- 33 Liberty Ln
- 38 Liberty Ln
- 52 Liberty Ln
- 37 Liberty Ln
- 35 Liberty Ln
- 83 Oldefield Farms Unit 83
- 85 Oldefield Farms Unit 85
- 3 Avon Street Extension
- 92 Post Office Rd
- 287 Hazard Ave
- 6 Cedar St
- 4 Georgetown Unit A
- 233 Post Office Rd
- 4 Bradley Cir Unit D
- 56 N Maple St