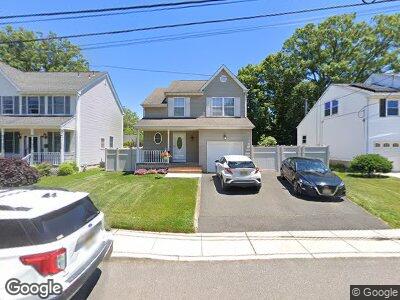
59 Kearney St Keyport, NJ 07735
Estimated Value: $567,000 - $659,719
4
Beds
3
Baths
2,000
Sq Ft
$307/Sq Ft
Est. Value
About This Home
This home is located at 59 Kearney St, Keyport, NJ 07735 and is currently estimated at $613,930, approximately $306 per square foot. 59 Kearney St is a home located in Monmouth County with nearby schools including Keyport Central School, Keyport High School, and Icob Academy.
Ownership History
Date
Name
Owned For
Owner Type
Purchase Details
Closed on
Mar 21, 1996
Sold by
Mills James
Bought by
Fitzgerald Kevin and Fitzgerald Pamela
Current Estimated Value
Home Financials for this Owner
Home Financials are based on the most recent Mortgage that was taken out on this home.
Original Mortgage
$1,132,000
Outstanding Balance
$120,414
Interest Rate
6.9%
Mortgage Type
FHA
Purchase Details
Closed on
Aug 30, 1995
Sold by
Donaldson Edwin
Bought by
Mills James and Mills Tracy
Create a Home Valuation Report for This Property
The Home Valuation Report is an in-depth analysis detailing your home's value as well as a comparison with similar homes in the area
Home Values in the Area
Average Home Value in this Area
Purchase History
| Date | Buyer | Sale Price | Title Company |
|---|---|---|---|
| Fitzgerald Kevin | $139,600 | -- | |
| Mills James | $43,000 | -- |
Source: Public Records
Mortgage History
| Date | Status | Borrower | Loan Amount |
|---|---|---|---|
| Open | Fitzgerald Pamela | $60,000 | |
| Open | Fitzgerald Pamela | $250,000 | |
| Closed | Fitzgerald Pamela A | $30,000 | |
| Closed | Fitzgerald Pamela A | $246,000 | |
| Open | Fitzgerald Kevin | $1,132,000 |
Source: Public Records
Tax History Compared to Growth
Tax History
| Year | Tax Paid | Tax Assessment Tax Assessment Total Assessment is a certain percentage of the fair market value that is determined by local assessors to be the total taxable value of land and additions on the property. | Land | Improvement |
|---|---|---|---|---|
| 2024 | $10,447 | $510,200 | $183,800 | $326,400 |
| 2023 | $10,447 | $475,300 | $167,100 | $308,200 |
| 2022 | $9,876 | $413,200 | $145,300 | $267,900 |
| 2021 | $9,876 | $391,300 | $134,500 | $256,800 |
| 2020 | $9,498 | $373,500 | $129,300 | $244,200 |
| 2019 | $9,214 | $362,900 | $124,300 | $238,600 |
| 2018 | $9,238 | $355,300 | $132,000 | $223,300 |
| 2017 | $9,059 | $347,500 | $127,000 | $220,500 |
| 2016 | $8,693 | $336,300 | $127,000 | $209,300 |
| 2015 | $8,334 | $320,900 | $112,000 | $208,900 |
| 2014 | $8,241 | $320,400 | $87,000 | $233,400 |
Source: Public Records
Map
Nearby Homes
- 75 Elizabeth St
- 130 Main St
- 37 Kearney St
- 14 Elizabeth St
- 162 Broad St
- 57 Osborn St
- 40 Church St
- 55 E Front St
- 108 Maple Place
- 100 1st St Unit 7
- 34-1 Green Grove Ave
- 231 Atlantic St Unit 81
- 124 1st St
- 98 Washington St
- 94 2nd St
- 253 Broadway
- 74 Manchester Ave
- 15 Haven Way Unit 4
- 204 Luppatatong Ave
- 0 3rd St Unit 22237788