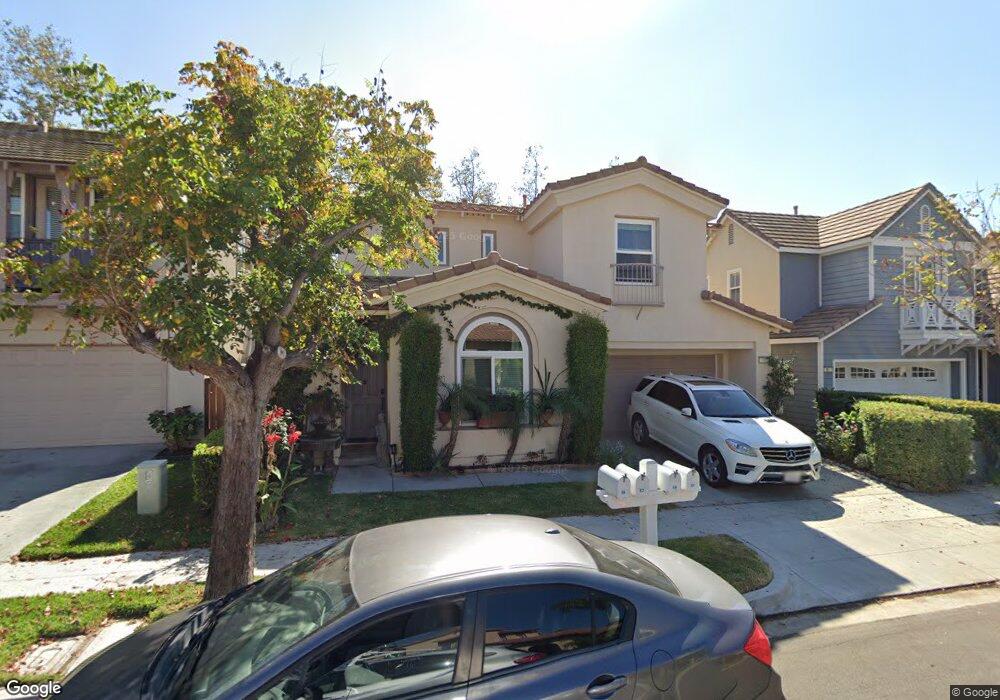
59 Kyle Ct Ladera Ranch, CA 92694
Estimated Value: $1,244,855 - $1,297,000
4
Beds
3
Baths
1,855
Sq Ft
$690/Sq Ft
Est. Value
About This Home
This home is located at 59 Kyle Ct, Ladera Ranch, CA 92694 and is currently estimated at $1,279,714, approximately $689 per square foot. 59 Kyle Ct is a home located in Orange County with nearby schools including Chaparral Elementary School, Ladera Ranch Middle School, and Tesoro High School.
Ownership History
Date
Name
Owned For
Owner Type
Purchase Details
Closed on
Nov 3, 2009
Sold by
Almazan Tayde F
Bought by
Nguyen Mixa and Nguyen Pheap
Current Estimated Value
Home Financials for this Owner
Home Financials are based on the most recent Mortgage that was taken out on this home.
Original Mortgage
$388,000
Interest Rate
4.77%
Mortgage Type
New Conventional
Purchase Details
Closed on
Aug 8, 2005
Sold by
Almazan Tayde F
Bought by
Almazan Tayde F
Home Financials for this Owner
Home Financials are based on the most recent Mortgage that was taken out on this home.
Original Mortgage
$555,500
Interest Rate
1%
Mortgage Type
Negative Amortization
Purchase Details
Closed on
Jul 9, 2004
Sold by
Espinosa Raymundo Y
Bought by
Almazan Tayde F
Home Financials for this Owner
Home Financials are based on the most recent Mortgage that was taken out on this home.
Original Mortgage
$480,000
Interest Rate
5.87%
Mortgage Type
New Conventional
Purchase Details
Closed on
Jun 30, 2004
Sold by
Cunningham James F
Bought by
Almazan Tayde F
Home Financials for this Owner
Home Financials are based on the most recent Mortgage that was taken out on this home.
Original Mortgage
$480,000
Interest Rate
5.87%
Mortgage Type
New Conventional
Purchase Details
Closed on
Nov 6, 2002
Sold by
Hu Shan Hong
Bought by
Cunningham James Francis
Home Financials for this Owner
Home Financials are based on the most recent Mortgage that was taken out on this home.
Original Mortgage
$300,700
Interest Rate
5.5%
Mortgage Type
Purchase Money Mortgage
Purchase Details
Closed on
Oct 28, 2002
Sold by
Urbina J David and Matuck Urbina Alyssa
Bought by
Cunningham James F
Home Financials for this Owner
Home Financials are based on the most recent Mortgage that was taken out on this home.
Original Mortgage
$300,700
Interest Rate
5.5%
Mortgage Type
Purchase Money Mortgage
Purchase Details
Closed on
Nov 12, 1999
Sold by
Sch Housing #6 Llc
Bought by
Urbina J David and Matuck Urbina Alyssa
Home Financials for this Owner
Home Financials are based on the most recent Mortgage that was taken out on this home.
Original Mortgage
$288,850
Interest Rate
7.83%
Create a Home Valuation Report for This Property
The Home Valuation Report is an in-depth analysis detailing your home's value as well as a comparison with similar homes in the area
Home Values in the Area
Average Home Value in this Area
Purchase History
| Date | Buyer | Sale Price | Title Company |
|---|---|---|---|
| Nguyen Mixa | $485,000 | Chicago Title Company | |
| Almazan Tayde F | -- | Ticor Title Company | |
| Almazan Tayde F | -- | Equity Title Company | |
| Almazan Tayde F | $600,000 | Equity Title Company | |
| Cunningham James Francis | -- | Stewart Title | |
| Cunningham James F | $431,500 | Stewart Title | |
| Urbina J David | $304,500 | First American Title Ins Co |
Source: Public Records
Mortgage History
| Date | Status | Borrower | Loan Amount |
|---|---|---|---|
| Previous Owner | Nguyen Mixa | $388,000 | |
| Previous Owner | Almazan Tayde F | $555,500 | |
| Previous Owner | Almazan Tayde F | $480,000 | |
| Previous Owner | Cunningham James F | $300,700 | |
| Previous Owner | Urbina J David | $288,850 | |
| Closed | Almazan Tayde F | $60,000 |
Source: Public Records
Tax History
| Year | Tax Paid | Tax Assessment Tax Assessment Total Assessment is a certain percentage of the fair market value that is determined by local assessors to be the total taxable value of land and additions on the property. | Land | Improvement |
|---|---|---|---|---|
| 2025 | $8,186 | $626,043 | $365,047 | $260,996 |
| 2024 | $8,186 | $613,768 | $357,889 | $255,879 |
| 2023 | $8,041 | $601,734 | $350,872 | $250,862 |
| 2022 | $7,891 | $589,936 | $343,992 | $245,944 |
| 2021 | $7,759 | $578,369 | $337,247 | $241,122 |
| 2020 | $7,648 | $572,439 | $333,789 | $238,650 |
| 2019 | $7,698 | $561,215 | $327,244 | $233,971 |
| 2018 | $7,653 | $550,211 | $320,827 | $229,384 |
| 2017 | $7,728 | $539,423 | $314,536 | $224,887 |
| 2016 | $7,646 | $528,847 | $308,369 | $220,478 |
| 2015 | $7,692 | $520,904 | $303,737 | $217,167 |
| 2014 | $7,701 | $510,701 | $297,788 | $212,913 |
Source: Public Records
Map
Nearby Homes
- 28 Albany St Unit 77
- 48 Half Moon Trail
- 9 Paverstone Ln
- 146 Main St
- 518 Afterglow Dr
- 8 Claymont Dr
- 29 Maybeck Ln
- 9 Three Vines Ct
- 7 Laurelhurst Dr
- 5 Lansdale Ct
- 21 Winslow St
- 36 Amesbury Ct
- 30 Savannah Ln
- 12 Roycroft Ct
- 1 Flowerdale
- 2 Aryshire Ln
- 14 Garrison Loop
- 129 Sklar St Unit 34
- 5232 Solace Dr
- 5257 Solace Dr
Your Personal Tour Guide
Ask me questions while you tour the home.