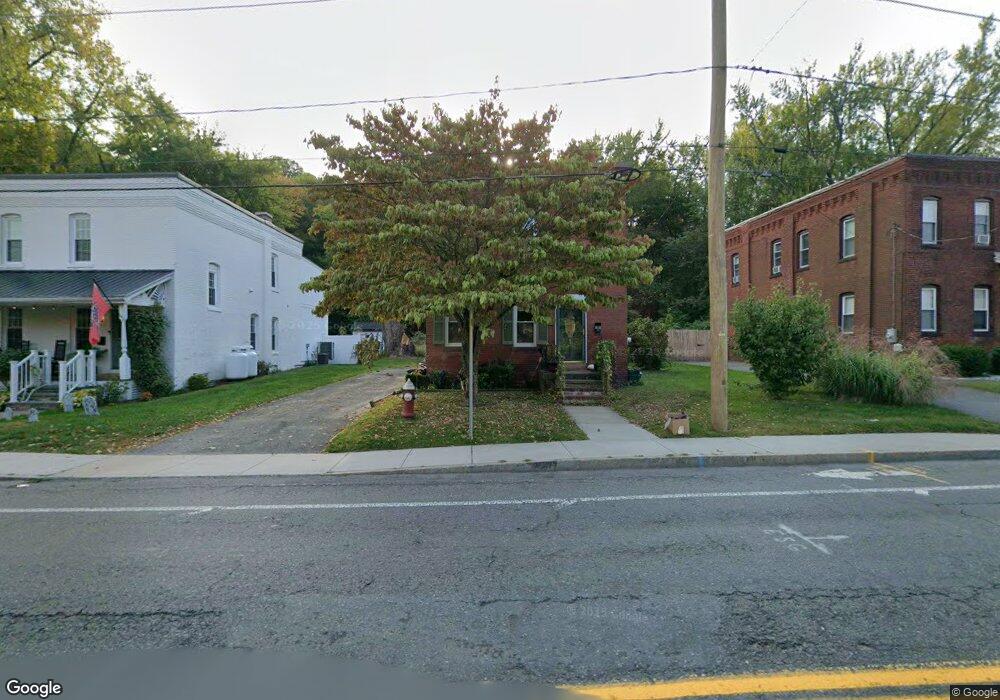
59 Lamb St South Hadley, MA 01075
Estimated Value: $246,904 - $294,000
3
Beds
1
Bath
1,228
Sq Ft
$219/Sq Ft
Est. Value
About This Home
This home is located at 59 Lamb St, South Hadley, MA 01075 and is currently estimated at $268,976, approximately $219 per square foot. 59 Lamb St is a home located in Hampshire County with nearby schools including Plains Elementary School, Mosier Elementary School, and Michael E. Smith Middle School.
Ownership History
Date
Name
Owned For
Owner Type
Purchase Details
Closed on
Sep 6, 2007
Sold by
Beattie Edward B and Beattie Lynne A
Bought by
Beattie Edward B
Current Estimated Value
Home Financials for this Owner
Home Financials are based on the most recent Mortgage that was taken out on this home.
Original Mortgage
$115,000
Outstanding Balance
$73,442
Interest Rate
6.74%
Mortgage Type
Purchase Money Mortgage
Estimated Equity
$195,534
Purchase Details
Closed on
Oct 1, 1993
Sold by
Beattie Edward and Beattie Ruth E
Bought by
Beattie Edward B
Home Financials for this Owner
Home Financials are based on the most recent Mortgage that was taken out on this home.
Original Mortgage
$56,450
Interest Rate
7%
Mortgage Type
Purchase Money Mortgage
Create a Home Valuation Report for This Property
The Home Valuation Report is an in-depth analysis detailing your home's value as well as a comparison with similar homes in the area
Home Values in the Area
Average Home Value in this Area
Purchase History
| Date | Buyer | Sale Price | Title Company |
|---|---|---|---|
| Beattie Edward B | -- | -- | |
| Beattie Edward B | $72,000 | -- |
Source: Public Records
Mortgage History
| Date | Status | Borrower | Loan Amount |
|---|---|---|---|
| Open | Beattie Edward B | $115,000 | |
| Previous Owner | Beattie Edward B | $25,000 | |
| Previous Owner | Beattie Edward B | $20,000 | |
| Previous Owner | Beattie Edward B | $56,450 | |
| Previous Owner | Beattie Edward B | $40,000 |
Source: Public Records
Tax History Compared to Growth
Tax History
| Year | Tax Paid | Tax Assessment Tax Assessment Total Assessment is a certain percentage of the fair market value that is determined by local assessors to be the total taxable value of land and additions on the property. | Land | Improvement |
|---|---|---|---|---|
| 2025 | $3,049 | $191,400 | $67,300 | $124,100 |
| 2024 | $3,129 | $187,900 | $62,900 | $125,000 |
| 2023 | $3,117 | $177,600 | $57,200 | $120,400 |
| 2022 | $2,979 | $161,200 | $57,200 | $104,000 |
| 2021 | $155 | $151,100 | $53,500 | $97,600 |
| 2020 | $2,867 | $143,800 | $53,500 | $90,300 |
| 2019 | $2,863 | $142,100 | $50,900 | $91,200 |
| 2018 | $156 | $137,700 | $49,400 | $88,300 |
| 2017 | $2,640 | $131,200 | $49,400 | $81,800 |
| 2016 | $2,588 | $130,400 | $49,400 | $81,000 |
| 2015 | $2,455 | $126,700 | $48,000 | $78,700 |
Source: Public Records
Map
Nearby Homes
- 32 North St
- 27 Bardwell St Unit 4
- 3 Ralph Ave
- 25 Maple St
- 35 Ludlow Rd
- 133 Granby Rd
- 70 Lathrop St
- 318 Newton St
- 48 N Canal St
- 39 W Summit St Unit 36
- 41 W Summit St Unit 32
- 41 W Summit St Unit 55
- 41 W Summit St Unit 38
- 18 Susan Ave
- 84 Judd Ave
- 55 Dowds Ln
- 40 Saint Kolbe Dr Unit A
- 63-65 Mosher St
- 75 Elm St
- 47 Pynchon Rd