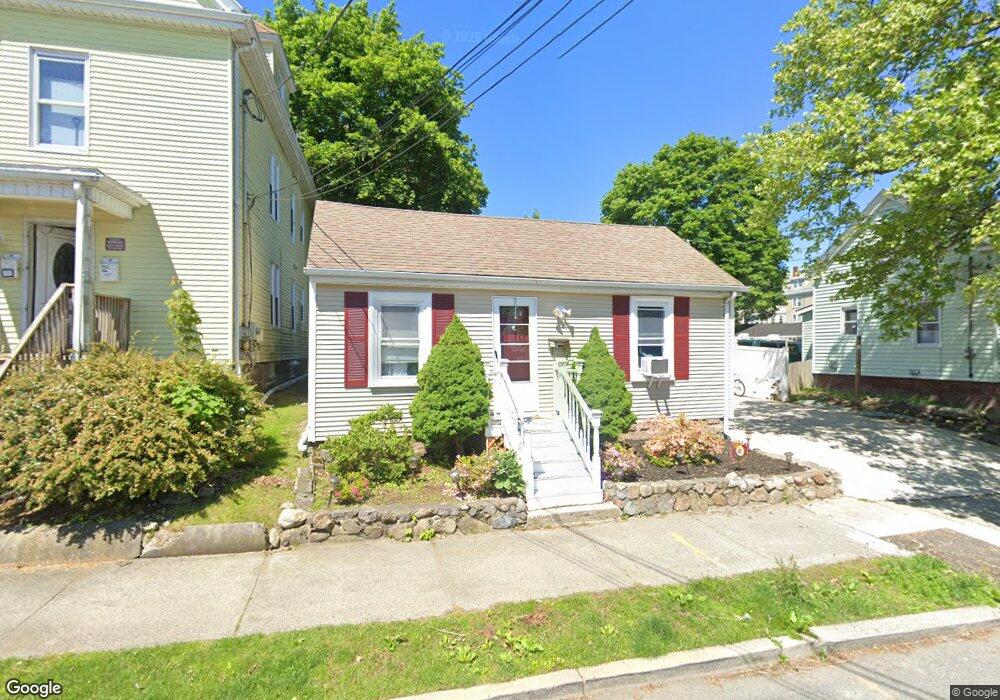
59 Laurel St Lynn, MA 01905
Lower Boston Street NeighborhoodEstimated Value: $477,000 - $520,000
3
Beds
2
Baths
1,183
Sq Ft
$422/Sq Ft
Est. Value
About This Home
This home is located at 59 Laurel St, Lynn, MA 01905 and is currently estimated at $499,743, approximately $422 per square foot. 59 Laurel St is a home located in Essex County with nearby schools including William R. Fallon School, Drewicz Elementary School, and Breed Middle School.
Ownership History
Date
Name
Owned For
Owner Type
Purchase Details
Closed on
Feb 27, 2008
Sold by
Galdamez Alfredo
Bought by
Bennett Joanne L
Current Estimated Value
Purchase Details
Closed on
Jun 9, 2006
Sold by
Brown Deborah A and Brown Mark W
Bought by
Galdamez Alfredo
Home Financials for this Owner
Home Financials are based on the most recent Mortgage that was taken out on this home.
Original Mortgage
$230,850
Interest Rate
6.62%
Mortgage Type
Purchase Money Mortgage
Purchase Details
Closed on
Dec 16, 1999
Sold by
Phoenix Ret and Bubier Thomas A
Bought by
Medeiros Gregory and Medeiros Deborah A
Purchase Details
Closed on
Feb 12, 1999
Sold by
Est Goss Robert N and Goss Robert N
Bought by
Phoenix Real Estate T and Perkins Andrew B
Create a Home Valuation Report for This Property
The Home Valuation Report is an in-depth analysis detailing your home's value as well as a comparison with similar homes in the area
Home Values in the Area
Average Home Value in this Area
Purchase History
| Date | Buyer | Sale Price | Title Company |
|---|---|---|---|
| Bennett Joanne L | $182,000 | -- | |
| Bennett Joanne L | $182,000 | -- | |
| Galdamez Alfredo | $243,000 | -- | |
| Galdamez Alfredo | $243,000 | -- | |
| Medeiros Gregory | $155,000 | -- | |
| Medeiros Gregory | $155,000 | -- | |
| Phoenix Real Estate T | $35,000 | -- | |
| Phoenix Real Estate T | $35,000 | -- |
Source: Public Records
Mortgage History
| Date | Status | Borrower | Loan Amount |
|---|---|---|---|
| Previous Owner | Phoenix Real Estate T | $267,000 | |
| Previous Owner | Phoenix Real Estate T | $230,850 |
Source: Public Records
Tax History
| Year | Tax Paid | Tax Assessment Tax Assessment Total Assessment is a certain percentage of the fair market value that is determined by local assessors to be the total taxable value of land and additions on the property. | Land | Improvement |
|---|---|---|---|---|
| 2025 | $4,930 | $475,900 | $206,900 | $269,000 |
| 2024 | $4,600 | $436,800 | $192,400 | $244,400 |
| 2023 | $4,793 | $429,900 | $212,800 | $217,100 |
| 2022 | $4,319 | $347,500 | $163,000 | $184,500 |
| 2021 | $4,031 | $309,400 | $140,800 | $168,600 |
| 2020 | $4,123 | $307,700 | $144,400 | $163,300 |
| 2019 | $4,000 | $279,700 | $129,000 | $150,700 |
| 2018 | $3,759 | $248,100 | $116,400 | $131,700 |
| 2017 | $3,527 | $226,100 | $101,900 | $124,200 |
| 2016 | $3,346 | $206,800 | $93,700 | $113,100 |
| 2015 | $3,286 | $196,200 | $96,400 | $99,800 |
Source: Public Records
Map
Nearby Homes
- 79 Laurel St
- 45 Cottage St Unit 3
- 16 River St Unit 6
- 20 Murray St
- 28 Wyman St
- 73 Waterhill St
- 10 River Street Place
- 21 Fenton Ave
- 50-50A Kirtland St
- 37 Sargents Ct
- 93 Robinson St
- 117 South St
- 268 Walnut St
- 95 Oakville St
- 32 Birch Brook Landing Unit 25
- 32 Birch Brook Landing Unit 22
- 9 Spencer Ave
- 44 Ballard St
- 32 Birch Brook Rd Unit 13
- 32 Birch Brook Rd Unit 27
Your Personal Tour Guide
Ask me questions while you tour the home.