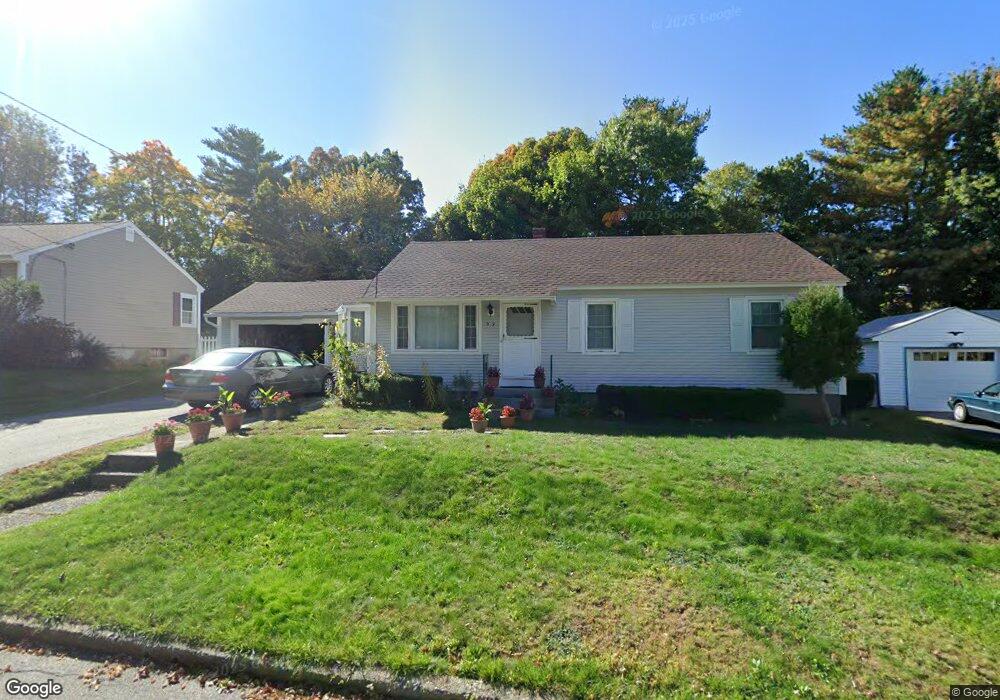
59 Leewood St Manchester, NH 03103
Southside NeighborhoodEstimated Value: $372,000 - $399,716
3
Beds
1
Bath
912
Sq Ft
$424/Sq Ft
Est. Value
About This Home
This home is located at 59 Leewood St, Manchester, NH 03103 and is currently estimated at $386,929, approximately $424 per square foot. 59 Leewood St is a home located in Hillsborough County with nearby schools including Jewett Street Elementary School, Southside Middle School, and Manchester Memorial High School.
Ownership History
Date
Name
Owned For
Owner Type
Purchase Details
Closed on
Jun 1, 2018
Sold by
Montour William O and Montour Shirley E
Bought by
Balle Vasil and Balle Anita
Current Estimated Value
Home Financials for this Owner
Home Financials are based on the most recent Mortgage that was taken out on this home.
Original Mortgage
$135,920
Outstanding Balance
$117,282
Interest Rate
4.4%
Mortgage Type
Purchase Money Mortgage
Estimated Equity
$269,647
Create a Home Valuation Report for This Property
The Home Valuation Report is an in-depth analysis detailing your home's value as well as a comparison with similar homes in the area
Home Values in the Area
Average Home Value in this Area
Purchase History
| Date | Buyer | Sale Price | Title Company |
|---|---|---|---|
| Balle Vasil | $169,933 | -- |
Source: Public Records
Mortgage History
| Date | Status | Borrower | Loan Amount |
|---|---|---|---|
| Open | Balle Vasil | $135,920 |
Source: Public Records
Tax History Compared to Growth
Tax History
| Year | Tax Paid | Tax Assessment Tax Assessment Total Assessment is a certain percentage of the fair market value that is determined by local assessors to be the total taxable value of land and additions on the property. | Land | Improvement |
|---|---|---|---|---|
| 2024 | $5,030 | $256,900 | $102,400 | $154,500 |
| 2023 | $4,845 | $256,900 | $102,400 | $154,500 |
| 2022 | $4,686 | $256,900 | $102,400 | $154,500 |
| 2021 | $4,542 | $256,900 | $102,400 | $154,500 |
| 2020 | $4,202 | $170,400 | $70,600 | $99,800 |
| 2019 | $4,144 | $170,400 | $70,600 | $99,800 |
| 2018 | $4,035 | $170,400 | $70,600 | $99,800 |
| 2017 | $3,974 | $170,400 | $70,600 | $99,800 |
| 2016 | $3,943 | $170,400 | $70,600 | $99,800 |
| 2015 | $3,868 | $165,000 | $65,400 | $99,600 |
| 2014 | $3,878 | $165,000 | $65,400 | $99,600 |
| 2013 | $3,741 | $165,000 | $65,400 | $99,600 |
Source: Public Records
Map
Nearby Homes