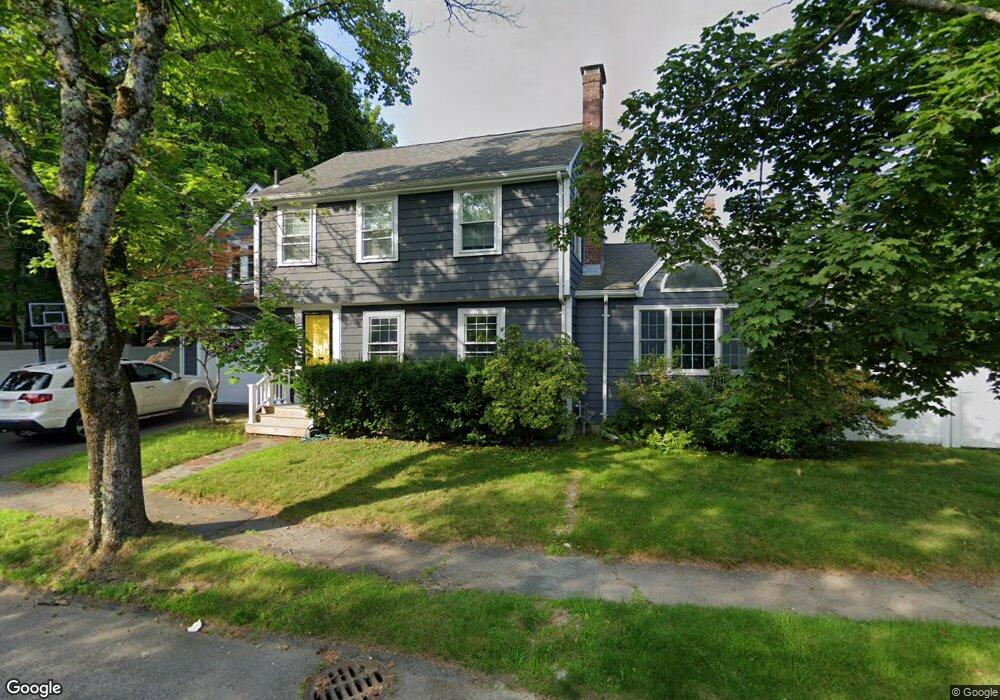
59 Lodge St Milton, MA 02186
Milton Hill NeighborhoodEstimated Value: $1,010,000 - $1,202,000
4
Beds
3
Baths
2,077
Sq Ft
$543/Sq Ft
Est. Value
About This Home
This home is located at 59 Lodge St, Milton, MA 02186 and is currently estimated at $1,127,392, approximately $542 per square foot. 59 Lodge St is a home located in Norfolk County with nearby schools including Milton High School, St. Agatha School, and Milton Academy.
Ownership History
Date
Name
Owned For
Owner Type
Purchase Details
Closed on
Mar 29, 2005
Sold by
Sabin James W and Oneill Mary P
Bought by
Wing Yip Lisa and Wing Luie
Current Estimated Value
Home Financials for this Owner
Home Financials are based on the most recent Mortgage that was taken out on this home.
Original Mortgage
$230,000
Outstanding Balance
$116,990
Interest Rate
5.56%
Mortgage Type
Purchase Money Mortgage
Estimated Equity
$1,010,402
Create a Home Valuation Report for This Property
The Home Valuation Report is an in-depth analysis detailing your home's value as well as a comparison with similar homes in the area
Home Values in the Area
Average Home Value in this Area
Purchase History
| Date | Buyer | Sale Price | Title Company |
|---|---|---|---|
| Wing Yip Lisa | $525,000 | -- |
Source: Public Records
Mortgage History
| Date | Status | Borrower | Loan Amount |
|---|---|---|---|
| Open | Wing Yip Lisa | $230,000 |
Source: Public Records
Tax History
| Year | Tax Paid | Tax Assessment Tax Assessment Total Assessment is a certain percentage of the fair market value that is determined by local assessors to be the total taxable value of land and additions on the property. | Land | Improvement |
|---|---|---|---|---|
| 2025 | $10,709 | $965,600 | $507,100 | $458,500 |
| 2024 | $10,420 | $954,200 | $482,900 | $471,300 |
| 2023 | $10,224 | $896,800 | $447,800 | $449,000 |
| 2022 | $9,939 | $797,000 | $447,800 | $349,200 |
| 2021 | $9,163 | $697,900 | $365,300 | $332,600 |
| 2020 | $8,874 | $676,400 | $350,000 | $326,400 |
| 2019 | $8,655 | $656,700 | $339,800 | $316,900 |
| 2018 | $8,294 | $600,600 | $290,200 | $310,400 |
| 2017 | $7,760 | $572,300 | $276,400 | $295,900 |
| 2016 | $7,012 | $519,400 | $250,100 | $269,300 |
| 2015 | $6,881 | $493,600 | $230,300 | $263,300 |
Source: Public Records
Map
Nearby Homes
- 111-113 Pleasant St
- 403405 Reedsdale Rd
- 3 Horton Place
- 50 Marine Rd
- 46 Century Ln
- 6 Brewster Rd
- 104 Gulliver St
- 397 Adams St
- 85 Forbes Rd
- 400 Adams St Unit A
- 141 Gardiner Rd
- 4 Farmer Rd
- 57 Columbine Rd
- 161 Sassamon Ave
- 72 Columbine Rd
- 137 Thacher St Unit 137
- 96 Houston Ave
- 7 Preacher Rd
- 7 Parkway Crescent
- 36 Central Ave Unit 4