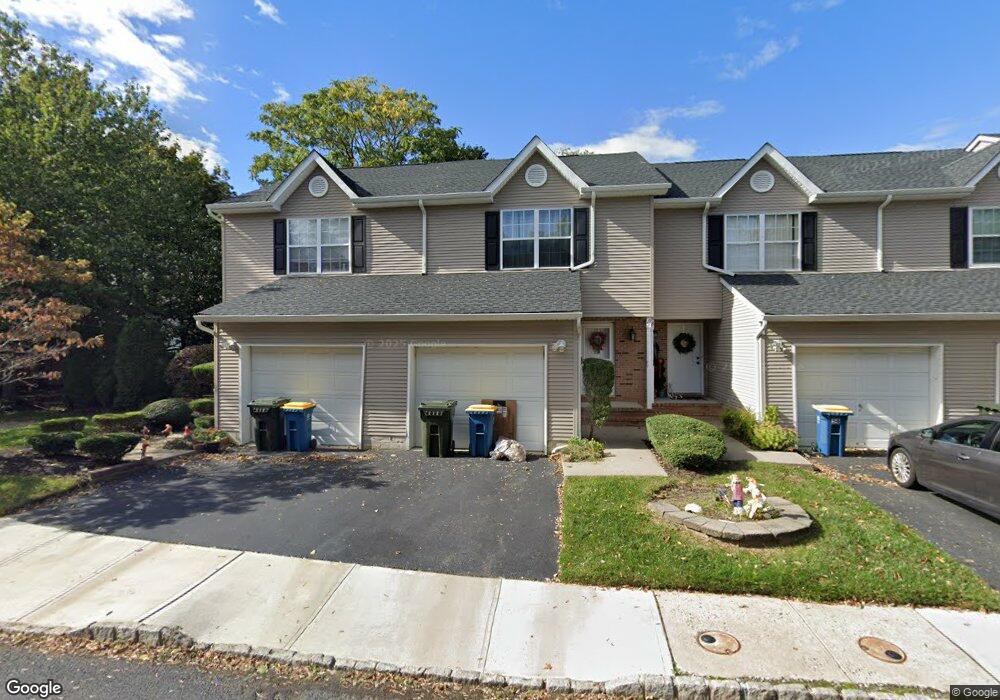
59 Lucia Ct Matawan, NJ 07747
Estimated Value: $470,906 - $511,000
2
Beds
3
Baths
1,284
Sq Ft
$382/Sq Ft
Est. Value
About This Home
This home is located at 59 Lucia Ct, Matawan, NJ 07747 and is currently estimated at $490,227, approximately $381 per square foot. 59 Lucia Ct is a home located in Monmouth County with nearby schools including Matawan Reg High School, St. Joseph Elementary School, and Icob Academy.
Ownership History
Date
Name
Owned For
Owner Type
Purchase Details
Closed on
Dec 8, 2011
Sold by
Skurka Denise
Bought by
Oreto William
Current Estimated Value
Home Financials for this Owner
Home Financials are based on the most recent Mortgage that was taken out on this home.
Original Mortgage
$224,071
Outstanding Balance
$152,573
Interest Rate
3.99%
Mortgage Type
FHA
Estimated Equity
$337,654
Purchase Details
Closed on
Dec 30, 1998
Sold by
Crossing At Aberdeen Inc
Bought by
Skurka Denise
Home Financials for this Owner
Home Financials are based on the most recent Mortgage that was taken out on this home.
Original Mortgage
$109,750
Interest Rate
6.8%
Create a Home Valuation Report for This Property
The Home Valuation Report is an in-depth analysis detailing your home's value as well as a comparison with similar homes in the area
Home Values in the Area
Average Home Value in this Area
Purchase History
| Date | Buyer | Sale Price | Title Company |
|---|---|---|---|
| Oreto William | $229,900 | Commonwealth | |
| Skurka Denise | $142,774 | -- |
Source: Public Records
Mortgage History
| Date | Status | Borrower | Loan Amount |
|---|---|---|---|
| Open | Oreto William | $224,071 | |
| Previous Owner | Skurka Denise | $109,750 |
Source: Public Records
Tax History Compared to Growth
Tax History
| Year | Tax Paid | Tax Assessment Tax Assessment Total Assessment is a certain percentage of the fair market value that is determined by local assessors to be the total taxable value of land and additions on the property. | Land | Improvement |
|---|---|---|---|---|
| 2025 | $7,186 | $415,300 | $225,200 | $190,100 |
| 2024 | $7,453 | $373,900 | $172,000 | $201,900 |
| 2023 | $7,453 | $366,400 | $169,200 | $197,200 |
| 2022 | $7,279 | $324,300 | $136,500 | $187,800 |
| 2021 | $6,982 | $283,000 | $116,000 | $167,000 |
| 2020 | $6,982 | $270,200 | $107,000 | $163,200 |
| 2019 | $6,903 | $259,300 | $97,000 | $162,300 |
| 2018 | $6,601 | $248,700 | $92,000 | $156,700 |
| 2017 | $6,530 | $249,800 | $96,000 | $153,800 |
| 2016 | $6,498 | $246,800 | $95,000 | $151,800 |
| 2015 | $5,752 | $220,400 | $50,400 | $170,000 |
| 2014 | $5,612 | $219,300 | $50,400 | $168,900 |
Source: Public Records
Map
Nearby Homes
- 7 Lucia Ct Unit 7
- 39-41 Atlantic Ave
- 101 Broad St
- 14 Dolan Ave
- 70 Northland Ln
- 9 Fountain Ave
- 23 Mathiasen Place
- 5 7th St
- 154 Lower Main St
- 10 7th St
- 34 Oak Knoll Dr
- 570 Line Rd
- 557 Lloyd Rd Unit B
- 537 S Atlantic Ave
- 111 Courtland Ln
- 3 Avondale Ln
- 15 Janine Place
- 258 Jackson St
- 22 Lower Main St
- 18 Oak Knoll Dr