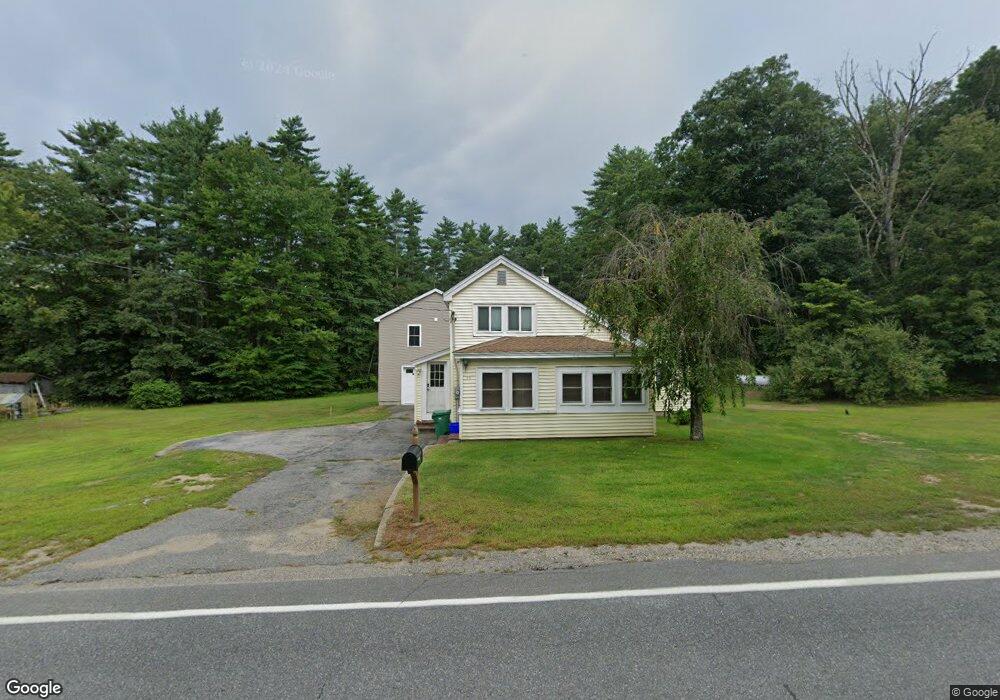
59 Main St Fremont, NH 03044
Estimated Value: $429,000 - $484,319
3
Beds
1
Bath
1,491
Sq Ft
$310/Sq Ft
Est. Value
About This Home
This home is located at 59 Main St, Fremont, NH 03044 and is currently estimated at $461,580, approximately $309 per square foot. 59 Main St is a home located in Rockingham County with nearby schools including Ellis School.
Ownership History
Date
Name
Owned For
Owner Type
Purchase Details
Closed on
Feb 22, 2010
Sold by
Goudin Steven J and Goudin Christine M
Bought by
Duquette Joseph R
Current Estimated Value
Home Financials for this Owner
Home Financials are based on the most recent Mortgage that was taken out on this home.
Original Mortgage
$105,000
Outstanding Balance
$69,977
Interest Rate
5.17%
Mortgage Type
Purchase Money Mortgage
Estimated Equity
$391,603
Purchase Details
Closed on
Aug 29, 2002
Sold by
Hartford Robert
Bought by
Goudin Steven J and Goudin Christine M
Home Financials for this Owner
Home Financials are based on the most recent Mortgage that was taken out on this home.
Original Mortgage
$152,605
Interest Rate
6.55%
Create a Home Valuation Report for This Property
The Home Valuation Report is an in-depth analysis detailing your home's value as well as a comparison with similar homes in the area
Home Values in the Area
Average Home Value in this Area
Purchase History
| Date | Buyer | Sale Price | Title Company |
|---|---|---|---|
| Duquette Joseph R | $150,000 | -- | |
| Goudin Steven J | $155,000 | -- |
Source: Public Records
Mortgage History
| Date | Status | Borrower | Loan Amount |
|---|---|---|---|
| Open | Goudin Steven J | $105,000 | |
| Previous Owner | Goudin Steven J | $152,605 |
Source: Public Records
Tax History Compared to Growth
Tax History
| Year | Tax Paid | Tax Assessment Tax Assessment Total Assessment is a certain percentage of the fair market value that is determined by local assessors to be the total taxable value of land and additions on the property. | Land | Improvement |
|---|---|---|---|---|
| 2024 | $6,901 | $261,700 | $98,600 | $163,100 |
| 2023 | $5,298 | $224,600 | $98,600 | $126,000 |
| 2022 | $5,208 | $224,600 | $98,600 | $126,000 |
| 2021 | $4,955 | $222,000 | $98,600 | $123,400 |
| 2020 | $5,135 | $222,000 | $98,600 | $123,400 |
| 2019 | $25 | $204,200 | $126,600 | $77,600 |
| 2018 | $6,273 | $204,200 | $126,600 | $77,600 |
| 2017 | $2,525 | $204,200 | $126,600 | $77,600 |
| 2016 | $6,101 | $204,200 | $126,600 | $77,600 |
| 2015 | $5,922 | $204,200 | $126,600 | $77,600 |
| 2014 | $6,079 | $215,400 | $141,900 | $73,500 |
| 2013 | $6,141 | $215,400 | $141,900 | $73,500 |
Source: Public Records
Map
Nearby Homes