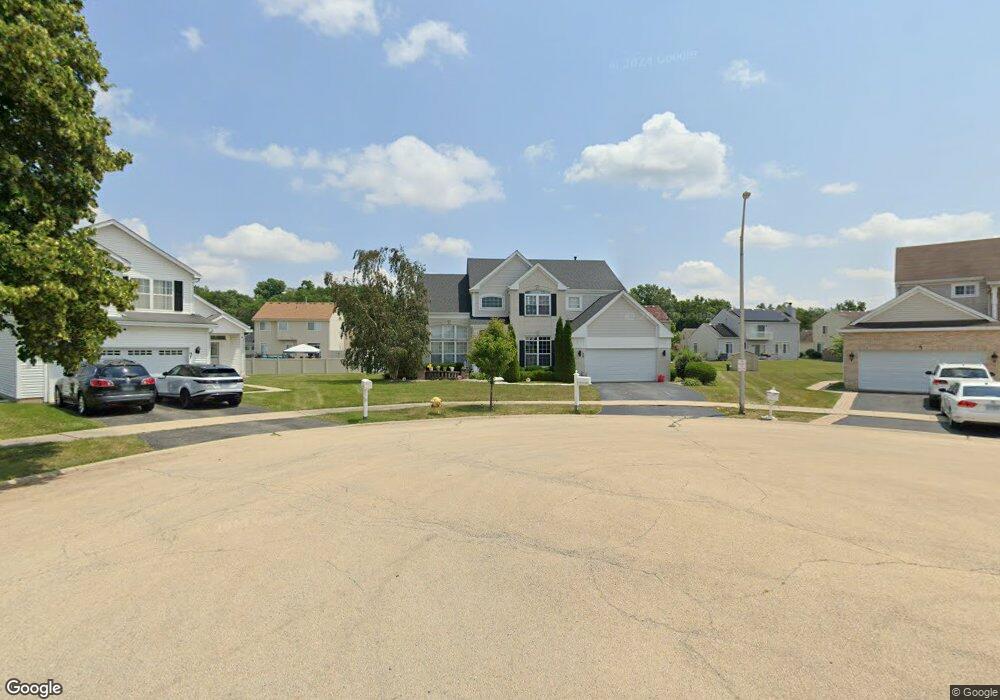
59 Moonlight Ct Matteson, IL 60443
Old Matteson NeighborhoodEstimated Value: $359,000 - $451,000
4
Beds
3
Baths
3,061
Sq Ft
$128/Sq Ft
Est. Value
About This Home
This home is located at 59 Moonlight Ct, Matteson, IL 60443 and is currently estimated at $390,908, approximately $127 per square foot. 59 Moonlight Ct is a home located in Cook County with nearby schools including Illinois School, Arcadia Elementary School, and Indiana Elementary School.
Ownership History
Date
Name
Owned For
Owner Type
Purchase Details
Closed on
Apr 30, 1999
Sold by
Matteson Development
Bought by
Wise Morgan E and Wise Ercell
Current Estimated Value
Home Financials for this Owner
Home Financials are based on the most recent Mortgage that was taken out on this home.
Original Mortgage
$194,350
Outstanding Balance
$45,777
Interest Rate
6.94%
Estimated Equity
$345,131
Create a Home Valuation Report for This Property
The Home Valuation Report is an in-depth analysis detailing your home's value as well as a comparison with similar homes in the area
Home Values in the Area
Average Home Value in this Area
Purchase History
| Date | Buyer | Sale Price | Title Company |
|---|---|---|---|
| Wise Morgan E | $243,000 | Ticor Title |
Source: Public Records
Mortgage History
| Date | Status | Borrower | Loan Amount |
|---|---|---|---|
| Open | Wise Morgan E | $194,350 |
Source: Public Records
Tax History
| Year | Tax Paid | Tax Assessment Tax Assessment Total Assessment is a certain percentage of the fair market value that is determined by local assessors to be the total taxable value of land and additions on the property. | Land | Improvement |
|---|---|---|---|---|
| 2025 | $6,099 | $36,000 | $7,663 | $28,337 |
| 2024 | $6,099 | $36,000 | $7,663 | $28,337 |
| 2023 | $7,944 | $36,000 | $7,663 | $28,337 |
| 2022 | $7,944 | $21,484 | $6,705 | $14,779 |
| 2021 | $8,518 | $21,484 | $6,705 | $14,779 |
| 2020 | $8,098 | $21,484 | $6,705 | $14,779 |
| 2019 | $10,232 | $25,943 | $6,066 | $19,877 |
| 2018 | $8,851 | $25,943 | $6,066 | $19,877 |
| 2017 | $8,348 | $25,943 | $6,066 | $19,877 |
| 2016 | $9,786 | $24,182 | $5,428 | $18,754 |
| 2015 | $9,596 | $24,182 | $5,428 | $18,754 |
| 2014 | $9,339 | $24,182 | $5,428 | $18,754 |
| 2013 | $9,341 | $26,148 | $5,428 | $20,720 |
Source: Public Records
Map
Nearby Homes
- 136 Moonlight Rd
- 154 Sundance Rd
- 20120 Keystone Ave
- 153 Treehouse Rd
- 4500 203rd St
- 19611 Crawford Ave
- 20001 Arquilla Cir
- 4141 204th St
- 4114 195th St Unit 76A
- 19424 Cypress Dr Unit 1C
- 19435 Hickory Place Unit 29A
- 620 Larkspur Ln
- 19361 Oak Ave Unit 19361
- 19409 Hickory Place Unit 32D
- 98 Lawrence Ln
- 4177 192nd Ct Unit 244
- 4133 192nd Ct Unit 219
- 4000 193rd St Unit 1B
- 4112 192nd Ct Unit 209
- 722 Kostner Ave
- 61 Moonlight Ct
- 57 Moonlight Ct
- 50 Sundance Rd
- 52 Sundance Rd
- 48 Sundance Rd
- 56 Sundance Rd
- 65 Moonlight Ct
- 103 Moonlight Rd
- 56 Moonlight Ct
- 46 Sundance Rd
- 54 Moonlight Ct
- 100 Sundance Rd
- 44 Sundance Rd
- 40 Sundance Rd
- 52 Moonlight Ct
- 109 Moonlight Rd
- 36 Sundance Rd
- 51 Sundance Rd
- 53 Sundance Rd
- 106 Sundance Rd
Your Personal Tour Guide
Ask me questions while you tour the home.