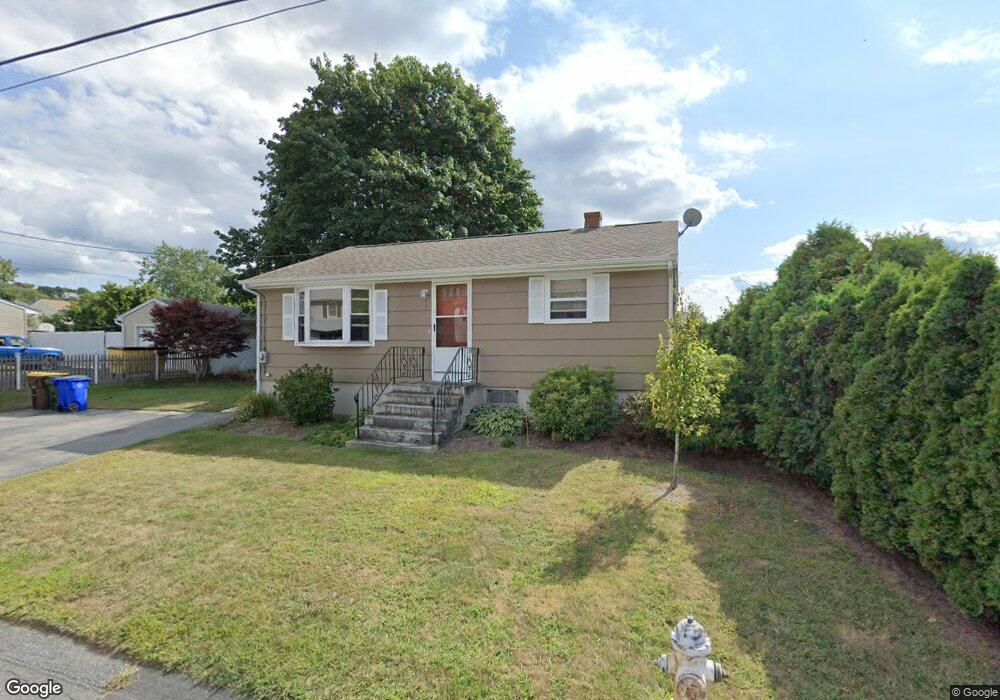
59 Moorland St Fall River, MA 02724
Sandy Beach NeighborhoodEstimated Value: $385,383 - $451,000
2
Beds
2
Baths
1,410
Sq Ft
$293/Sq Ft
Est. Value
About This Home
This home is located at 59 Moorland St, Fall River, MA 02724 and is currently estimated at $412,596, approximately $292 per square foot. 59 Moorland St is a home located in Bristol County with nearby schools including Carlton M. Viveiros Elementary School, Matthew J. Kuss Middle School, and B M C Durfee High School.
Ownership History
Date
Name
Owned For
Owner Type
Purchase Details
Closed on
May 26, 2006
Sold by
Augustine Karen Rozycki and Augustine Paul
Bought by
Teixeira Linda
Current Estimated Value
Home Financials for this Owner
Home Financials are based on the most recent Mortgage that was taken out on this home.
Original Mortgage
$199,200
Outstanding Balance
$116,851
Interest Rate
6.53%
Mortgage Type
Purchase Money Mortgage
Estimated Equity
$295,745
Purchase Details
Closed on
Mar 30, 2004
Sold by
Rozycki Bertha A and Augustine Karen Rozycki
Bought by
Augustine Karen Rozycki and Augustine Paul
Create a Home Valuation Report for This Property
The Home Valuation Report is an in-depth analysis detailing your home's value as well as a comparison with similar homes in the area
Home Values in the Area
Average Home Value in this Area
Purchase History
| Date | Buyer | Sale Price | Title Company |
|---|---|---|---|
| Teixeira Linda | $249,000 | -- | |
| Augustine Karen Rozycki | -- | -- |
Source: Public Records
Mortgage History
| Date | Status | Borrower | Loan Amount |
|---|---|---|---|
| Open | Teixeira Linda | $199,200 |
Source: Public Records
Tax History
| Year | Tax Paid | Tax Assessment Tax Assessment Total Assessment is a certain percentage of the fair market value that is determined by local assessors to be the total taxable value of land and additions on the property. | Land | Improvement |
|---|---|---|---|---|
| 2025 | $3,342 | $291,900 | $118,400 | $173,500 |
| 2024 | $3,155 | $274,600 | $116,100 | $158,500 |
| 2023 | $3,069 | $250,100 | $104,600 | $145,500 |
| 2022 | $2,722 | $215,700 | $98,700 | $117,000 |
| 2021 | $2,577 | $186,300 | $94,300 | $92,000 |
| 2020 | $2,488 | $172,200 | $90,000 | $82,200 |
| 2019 | $2,484 | $170,400 | $94,000 | $76,400 |
| 2018 | $2,468 | $168,800 | $94,700 | $74,100 |
| 2017 | $2,344 | $167,400 | $94,700 | $72,700 |
| 2016 | $2,268 | $166,400 | $97,600 | $68,800 |
| 2015 | $2,213 | $169,200 | $97,600 | $71,600 |
| 2014 | $2,129 | $169,200 | $97,600 | $71,600 |
Source: Public Records
Map
Nearby Homes
- 24 Valley St
- 391 Clarkson St
- 126 Wheeler St
- 579 Summit St Unit 3
- 579 Summit St Unit 2
- 2229 S Main St
- 30 Broad St
- 42 Main Rd
- 609 King Philip St
- 15 Higgins St
- 57 Larouche St
- 1852 S Main St
- 1846 S Main St
- 25 Mathew Rd
- 29 Robert St
- 234 Kilburn St
- 20 Wilcox St
- 12 Horizon Dr
- 917 Dwelly St
- 347 Main Rd Unit 103
Your Personal Tour Guide
Ask me questions while you tour the home.