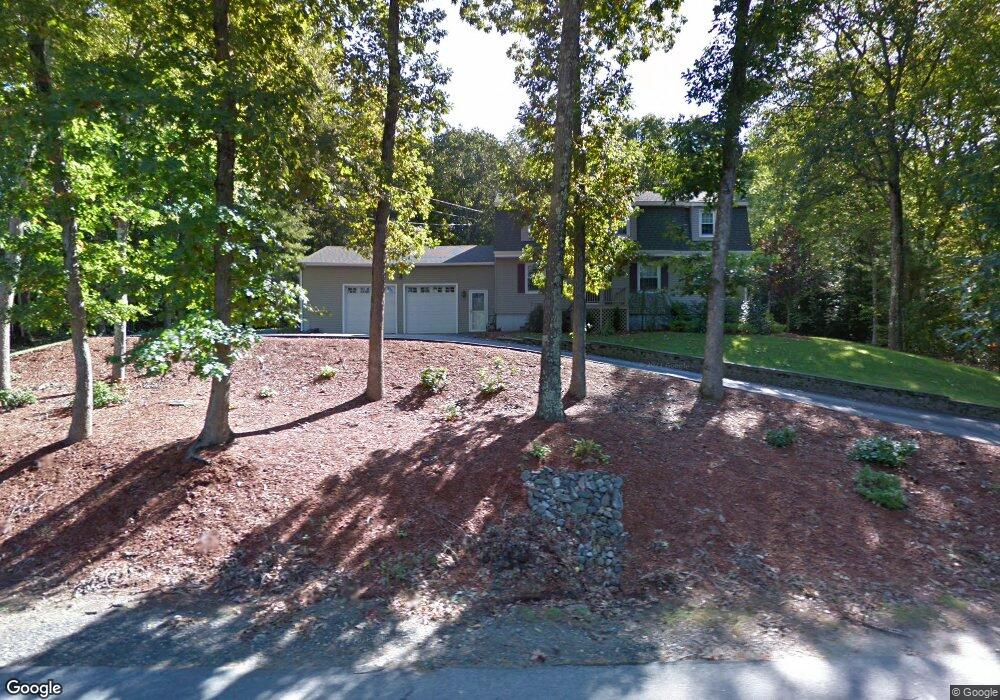
59 Nashua Rd Windham, NH 03087
Estimated Value: $740,098 - $849,000
4
Beds
3
Baths
2,400
Sq Ft
$333/Sq Ft
Est. Value
About This Home
This home is located at 59 Nashua Rd, Windham, NH 03087 and is currently estimated at $800,025, approximately $333 per square foot. 59 Nashua Rd is a home located in Rockingham County with nearby schools including Golden Brook Elementary School, Windham Middle School, and Windham High School.
Ownership History
Date
Name
Owned For
Owner Type
Purchase Details
Closed on
Oct 12, 2005
Sold by
Swift Douglas W
Bought by
Kramer Daniel R and Kramer Amy L
Current Estimated Value
Home Financials for this Owner
Home Financials are based on the most recent Mortgage that was taken out on this home.
Original Mortgage
$294,900
Interest Rate
5.78%
Create a Home Valuation Report for This Property
The Home Valuation Report is an in-depth analysis detailing your home's value as well as a comparison with similar homes in the area
Home Values in the Area
Average Home Value in this Area
Purchase History
| Date | Buyer | Sale Price | Title Company |
|---|---|---|---|
| Kramer Daniel R | $419,900 | -- |
Source: Public Records
Mortgage History
| Date | Status | Borrower | Loan Amount |
|---|---|---|---|
| Open | Kramer Daniel R | $280,000 | |
| Closed | Kramer Daniel R | $284,000 | |
| Closed | Kramer Daniel R | $60,000 | |
| Closed | Kramer Daniel R | $294,900 |
Source: Public Records
Tax History
| Year | Tax Paid | Tax Assessment Tax Assessment Total Assessment is a certain percentage of the fair market value that is determined by local assessors to be the total taxable value of land and additions on the property. | Land | Improvement |
|---|---|---|---|---|
| 2024 | $9,375 | $414,100 | $160,700 | $253,400 |
| 2023 | $8,862 | $414,100 | $160,700 | $253,400 |
| 2022 | $8,183 | $414,100 | $160,700 | $253,400 |
| 2021 | $7,711 | $414,100 | $160,700 | $253,400 |
| 2020 | $7,922 | $414,100 | $160,700 | $253,400 |
| 2019 | $7,333 | $325,200 | $147,900 | $177,300 |
| 2018 | $7,499 | $322,000 | $147,900 | $174,100 |
| 2017 | $6,504 | $322,000 | $147,900 | $174,100 |
| 2016 | $7,026 | $322,000 | $147,900 | $174,100 |
| 2015 | $6,994 | $322,000 | $147,900 | $174,100 |
| 2014 | $8,122 | $338,400 | $178,000 | $160,400 |
| 2013 | $7,838 | $332,100 | $178,000 | $154,100 |
Source: Public Records
Map
Nearby Homes
- 2 Mulberry St
- 7 Tranquil Dr
- 7 Buckhide Rd
- 14 Londonderry Rd
- 87 Oakridge Dr
- 69 Oakridge Dr
- 47 Oakridge Dr
- 5 Hidden Valley Rd
- 22 Olde Country Village Rd
- 4 Elijah Hill Ln
- 33 Griffin Rd
- 4 Arbor Rd
- 16 Arbor Rd
- 98 Trails Edge Rd
- 106 N Lowell Rd
- 3 Holly Ln
- 5 Elise Ave Unit Lot 94
- 15A David Dr
- 14 Reed St
- 63 Mammoth Rd
Your Personal Tour Guide
Ask me questions while you tour the home.