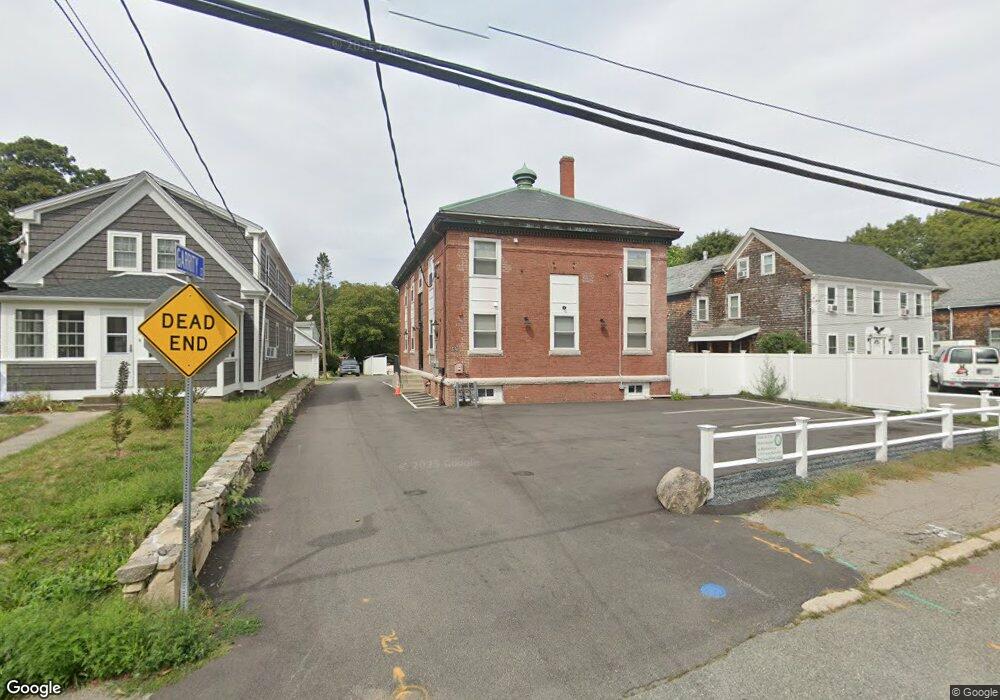
59 North Ave Unit 1 Rockland, MA 02370
Estimated Value: $548,446
7
Beds
4
Baths
3,300
Sq Ft
$166/Sq Ft
Est. Value
About This Home
This home is located at 59 North Ave Unit 1, Rockland, MA 02370 and is currently priced at $548,446, approximately $166 per square foot. 59 North Ave Unit 1 is a home located in Plymouth County with nearby schools including Rockland Senior High School, Calvary Chapel Academy, and St Bridget School.
Ownership History
Date
Name
Owned For
Owner Type
Purchase Details
Closed on
May 2, 2007
Sold by
Warmington Howard F
Bought by
Lighthouse Dev Llc and Aikens
Current Estimated Value
Home Financials for this Owner
Home Financials are based on the most recent Mortgage that was taken out on this home.
Original Mortgage
$240,000
Interest Rate
6.23%
Mortgage Type
Commercial
Create a Home Valuation Report for This Property
The Home Valuation Report is an in-depth analysis detailing your home's value as well as a comparison with similar homes in the area
Home Values in the Area
Average Home Value in this Area
Purchase History
| Date | Buyer | Sale Price | Title Company |
|---|---|---|---|
| Lighthouse Dev Llc | $305,000 | -- | |
| Lighthouse Dev Llc | $305,000 | -- |
Source: Public Records
Mortgage History
| Date | Status | Borrower | Loan Amount |
|---|---|---|---|
| Open | Lighthouse Dev Llc | $340,000 | |
| Closed | Lighthouse Dev Llc | $240,000 |
Source: Public Records
Tax History Compared to Growth
Tax History
| Year | Tax Paid | Tax Assessment Tax Assessment Total Assessment is a certain percentage of the fair market value that is determined by local assessors to be the total taxable value of land and additions on the property. | Land | Improvement |
|---|---|---|---|---|
| 2025 | $7,151 | $523,100 | $126,500 | $396,600 |
| 2024 | $7,670 | $545,500 | $120,500 | $425,000 |
| 2023 | $7,336 | $482,000 | $114,800 | $367,200 |
| 2022 | $5,931 | $354,100 | $107,300 | $246,800 |
| 2021 | $5,920 | $342,600 | $104,200 | $238,400 |
| 2020 | $6,548 | $332,400 | $101,100 | $231,300 |
| 2019 | $5,724 | $319,400 | $97,000 | $222,400 |
| 2018 | $5,603 | $307,500 | $91,100 | $216,400 |
| 2017 | $5,603 | $303,200 | $90,000 | $213,200 |
| 2016 | $5,495 | $297,200 | $88,200 | $209,000 |
| 2015 | $5,555 | $291,900 | $87,000 | $204,900 |
| 2014 | $5,249 | $286,200 | $85,300 | $200,900 |
Source: Public Records
Map
Nearby Homes
- 100 North Ave
- 11 Dyer St Unit 11
- 13 Dyer St Unit 13
- 1 Canterbury Ln
- 12 Dyer St Unit 12
- 14 Dyer St Unit 14
- 122 Reed St
- 6 Chestnut Cir
- 63 Webster St
- 11 Chestnut Cir
- 45-47 Park St
- 50 Linden Park
- 507 Liberty St
- 9 Juniper Cir
- 20 Birch St
- 5 Juniper Cir
- 83 Summit St
- 40 Fir Rd Unit 386
- 103 Grove St Unit 337
- 3 Hickory Cir