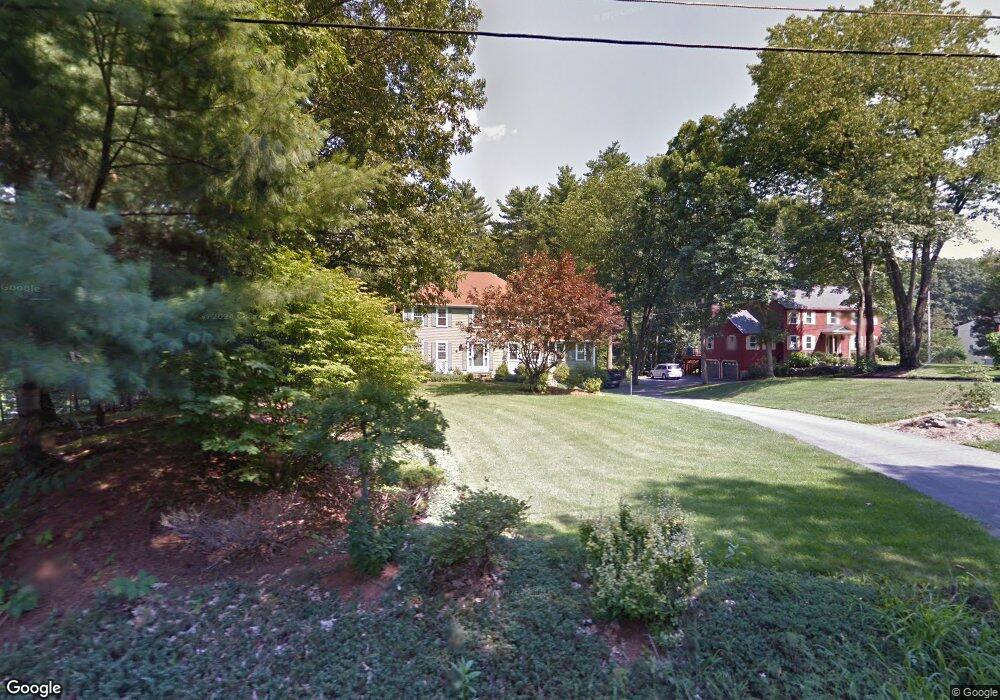
59 Oak Ave Northborough, MA 01532
Estimated Value: $799,375 - $970,000
4
Beds
3
Baths
2,420
Sq Ft
$359/Sq Ft
Est. Value
About This Home
This home is located at 59 Oak Ave, Northborough, MA 01532 and is currently estimated at $868,844, approximately $359 per square foot. 59 Oak Ave is a home located in Worcester County with nearby schools including Lincoln Street Elementary School, Robert E. Melican Middle School, and Algonquin Regional High School.
Ownership History
Date
Name
Owned For
Owner Type
Purchase Details
Closed on
Jan 14, 2005
Sold by
Cayer Germaine B and Cayer Richard J
Bought by
Ciszewski Kevin M and Ciszewski Michelle J
Current Estimated Value
Home Financials for this Owner
Home Financials are based on the most recent Mortgage that was taken out on this home.
Original Mortgage
$333,700
Outstanding Balance
$169,148
Interest Rate
5.81%
Mortgage Type
Purchase Money Mortgage
Estimated Equity
$699,696
Create a Home Valuation Report for This Property
The Home Valuation Report is an in-depth analysis detailing your home's value as well as a comparison with similar homes in the area
Home Values in the Area
Average Home Value in this Area
Purchase History
| Date | Buyer | Sale Price | Title Company |
|---|---|---|---|
| Ciszewski Kevin M | $495,000 | -- |
Source: Public Records
Mortgage History
| Date | Status | Borrower | Loan Amount |
|---|---|---|---|
| Open | Ciszewski Kevin M | $333,700 |
Source: Public Records
Tax History
| Year | Tax Paid | Tax Assessment Tax Assessment Total Assessment is a certain percentage of the fair market value that is determined by local assessors to be the total taxable value of land and additions on the property. | Land | Improvement |
|---|---|---|---|---|
| 2025 | $10,186 | $714,800 | $267,900 | $446,900 |
| 2024 | $9,272 | $649,300 | $222,100 | $427,200 |
| 2023 | $8,775 | $593,300 | $209,600 | $383,700 |
| 2022 | $8,441 | $511,900 | $199,600 | $312,300 |
| 2021 | $8,125 | $474,600 | $181,300 | $293,300 |
| 2020 | $8,308 | $481,600 | $181,300 | $300,300 |
| 2019 | $8,134 | $474,300 | $180,700 | $293,600 |
| 2018 | $7,747 | $445,500 | $171,000 | $274,500 |
| 2017 | $7,596 | $436,800 | $171,000 | $265,800 |
| 2016 | $7,441 | $433,400 | $167,600 | $265,800 |
| 2015 | $7,060 | $422,000 | $170,400 | $251,600 |
| 2014 | $6,795 | $409,600 | $170,400 | $239,200 |
Source: Public Records
Map
Nearby Homes
- 105 Lincoln St
- 217 W Main St
- 6 Lydias Way Unit 6
- 39 Pleasant St Unit A6
- 39 Pleasant St Unit C5
- 39 Pleasant St Unit A17
- 39 Pleasant St Unit B19
- 39 Pleasant St Unit B10
- 39 Pleasant St Unit B4
- 13 Dennis Cir
- 81 West St
- 5 Swan View Common Dr
- 19 Intervale Farm Ln
- 5 Country Candle Ln Unit 5
- 18 Joseph Rd
- 106 School St
- 29 Thayer St
- 85 Hudson St Unit 85
- 26 Treetop Cir
- 9 Morningside Dr
Your Personal Tour Guide
Ask me questions while you tour the home.