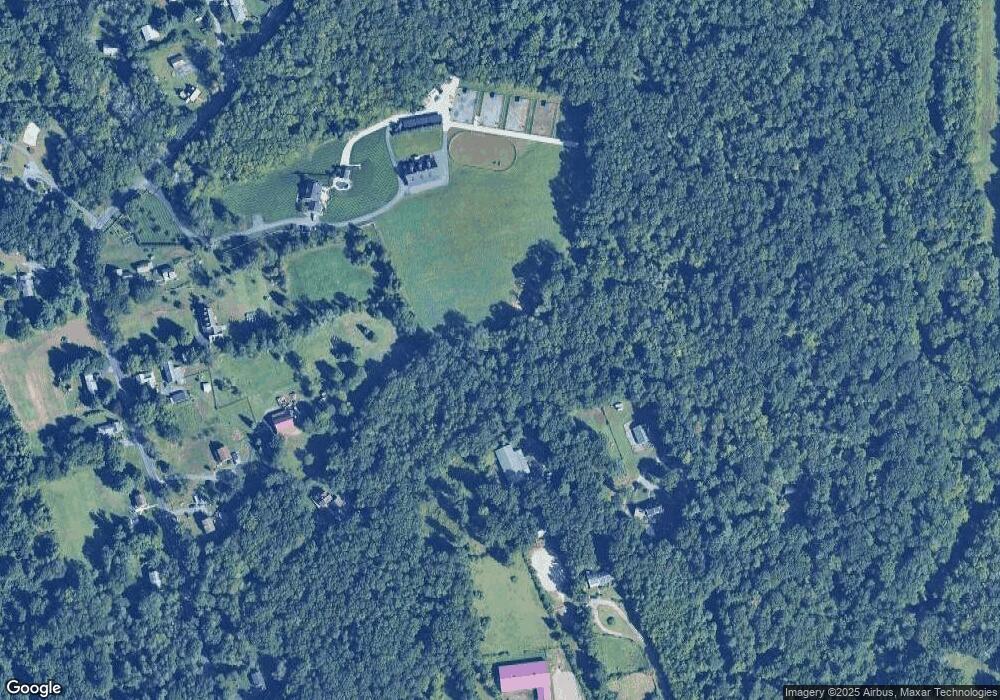
59 Pleasant St Rehoboth, MA 02769
Estimated Value: $518,915 - $665,000
4
Beds
2
Baths
1,843
Sq Ft
$313/Sq Ft
Est. Value
About This Home
This home is located at 59 Pleasant St, Rehoboth, MA 02769 and is currently estimated at $577,479, approximately $313 per square foot. 59 Pleasant St is a home located in Bristol County with nearby schools including Dighton-Rehoboth Regional High School and Highlander Charter Middle and High School.
Ownership History
Date
Name
Owned For
Owner Type
Purchase Details
Closed on
Dec 30, 2009
Sold by
Pike Charles R and Pike Teresa
Bought by
White Tr Tracy A and Pike David F
Current Estimated Value
Purchase Details
Closed on
Mar 25, 2003
Sold by
Pike Charles R and Pike Teresa
Bought by
Pike James and Pike Wendy
Purchase Details
Closed on
Mar 14, 2003
Sold by
Pike Charles R and Pike Teresa
Bought by
White Tracey A
Purchase Details
Closed on
Feb 10, 2003
Sold by
Holme Melanaie M and Holme Michael W
Bought by
Pike Charles R and Pike Teresa
Create a Home Valuation Report for This Property
The Home Valuation Report is an in-depth analysis detailing your home's value as well as a comparison with similar homes in the area
Home Values in the Area
Average Home Value in this Area
Purchase History
| Date | Buyer | Sale Price | Title Company |
|---|---|---|---|
| White Tr Tracy A | -- | -- | |
| Pike James | -- | -- | |
| Pike James | -- | -- | |
| White Tracey A | -- | -- | |
| Pike Charles R | $5,000 | -- |
Source: Public Records
Tax History Compared to Growth
Tax History
| Year | Tax Paid | Tax Assessment Tax Assessment Total Assessment is a certain percentage of the fair market value that is determined by local assessors to be the total taxable value of land and additions on the property. | Land | Improvement |
|---|---|---|---|---|
| 2025 | $37 | $332,900 | $184,000 | $148,900 |
| 2024 | $3,602 | $317,100 | $184,000 | $133,100 |
| 2023 | $4,003 | $345,700 | $214,000 | $131,700 |
| 2022 | $4,331 | $341,800 | $214,000 | $127,800 |
| 2021 | $3,357 | $328,800 | $206,200 | $122,600 |
| 2020 | $4,314 | $328,800 | $206,200 | $122,600 |
| 2018 | $4,421 | $303,100 | $198,400 | $104,700 |
| 2017 | $4,994 | $295,400 | $198,400 | $97,000 |
| 2016 | $3,589 | $295,400 | $198,400 | $97,000 |
| 2015 | $3,659 | $297,200 | $199,000 | $98,200 |
| 2014 | $3,538 | $284,400 | $191,800 | $92,600 |
Source: Public Records
Map
Nearby Homes