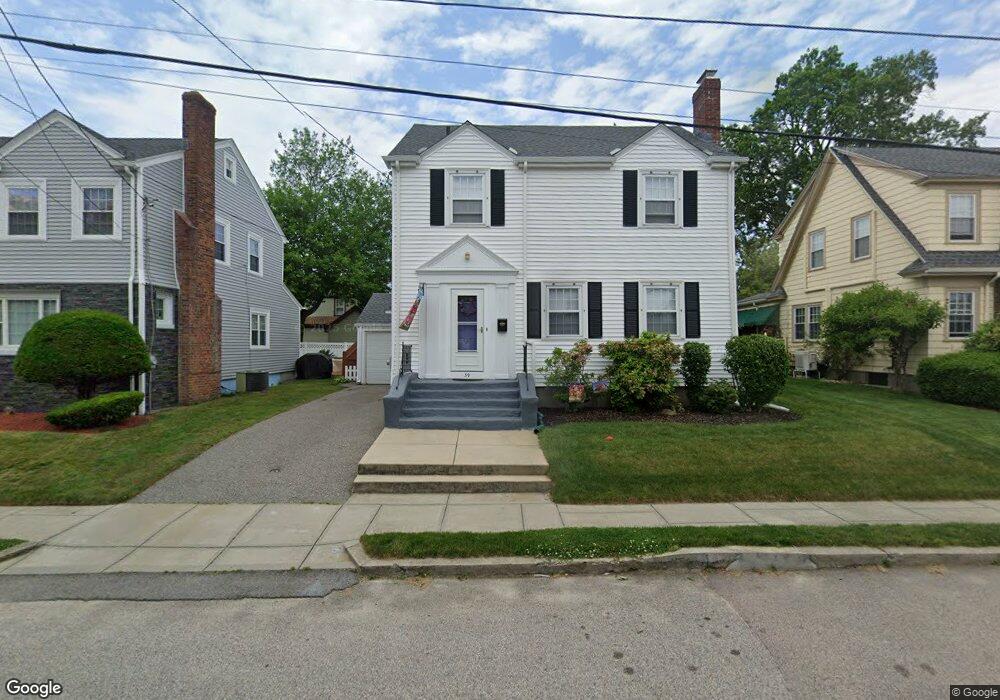
59 Potter St Cranston, RI 02910
Auburn NeighborhoodEstimated Value: $410,000 - $505,000
3
Beds
2
Baths
1,456
Sq Ft
$304/Sq Ft
Est. Value
About This Home
This home is located at 59 Potter St, Cranston, RI 02910 and is currently estimated at $441,961, approximately $303 per square foot. 59 Potter St is a home located in Providence County with nearby schools including Eden Park Elementary School, Park View Middle School, and Cranston High School East.
Ownership History
Date
Name
Owned For
Owner Type
Purchase Details
Closed on
Aug 2, 2023
Sold by
Gasbarro Terrence M and Gasbarro Janet M
Bought by
Terrence and Terrence Janet Gasbarro
Current Estimated Value
Purchase Details
Closed on
Jul 18, 1994
Sold by
Koch Rosemary Flynn
Bought by
Gasbarro Mario D and Gasbarro Janet
Home Financials for this Owner
Home Financials are based on the most recent Mortgage that was taken out on this home.
Original Mortgage
$46,000
Interest Rate
8.51%
Mortgage Type
Purchase Money Mortgage
Create a Home Valuation Report for This Property
The Home Valuation Report is an in-depth analysis detailing your home's value as well as a comparison with similar homes in the area
Home Values in the Area
Average Home Value in this Area
Purchase History
| Date | Buyer | Sale Price | Title Company |
|---|---|---|---|
| Terrence | -- | None Available | |
| Gasbarro Mario D | $109,000 | -- |
Source: Public Records
Mortgage History
| Date | Status | Borrower | Loan Amount |
|---|---|---|---|
| Previous Owner | Gasbarro Mario D | $46,000 |
Source: Public Records
Tax History
| Year | Tax Paid | Tax Assessment Tax Assessment Total Assessment is a certain percentage of the fair market value that is determined by local assessors to be the total taxable value of land and additions on the property. | Land | Improvement |
|---|---|---|---|---|
| 2025 | $4,716 | $339,800 | $93,600 | $246,200 |
| 2024 | $4,625 | $339,800 | $93,600 | $246,200 |
| 2023 | $4,642 | $245,600 | $64,600 | $181,000 |
| 2022 | $4,546 | $245,600 | $64,600 | $181,000 |
| 2021 | $4,421 | $245,600 | $64,600 | $181,000 |
| 2020 | $4,285 | $206,300 | $61,300 | $145,000 |
| 2019 | $4,285 | $206,300 | $61,300 | $145,000 |
| 2018 | $4,186 | $206,300 | $61,300 | $145,000 |
| 2017 | $4,104 | $178,900 | $45,200 | $133,700 |
| 2016 | $4,016 | $178,900 | $45,200 | $133,700 |
| 2015 | $4,016 | $178,900 | $45,200 | $133,700 |
| 2014 | $3,803 | $166,500 | $45,200 | $121,300 |
Source: Public Records
Map
Nearby Homes
- 181 Grace St
- 363 Pontiac Ave
- 288 Pontiac Ave
- 124 Clarence St
- 144 Laurens St
- 90 Garden St
- 152 Woodbine St
- 140 Eldridge St
- 43 Woodbine St
- 80 Colonial Ave
- 326 Beckwith St
- 309 Station St
- 0 Lambert St
- 77 Victory St
- 10 Dale Ave
- 102 Dixon St Unit 12
- 1302 Elmwood Ave
- 113 Caporal St
- 41 Cottage St
- 555 Park Ave
Your Personal Tour Guide
Ask me questions while you tour the home.