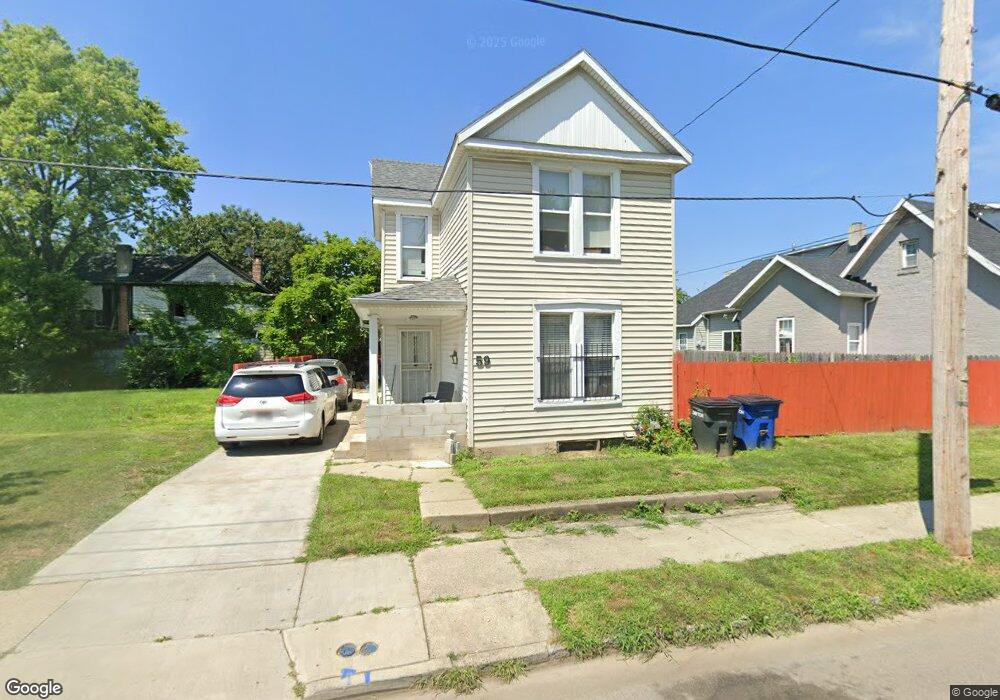
59 S van Lear St Dayton, OH 45403
Historic Inner East NeighborhoodEstimated Value: $82,722 - $135,000
3
Beds
2
Baths
1,260
Sq Ft
$78/Sq Ft
Est. Value
About This Home
This home is located at 59 S van Lear St, Dayton, OH 45403 and is currently estimated at $98,431, approximately $78 per square foot. 59 S van Lear St is a home located in Montgomery County with nearby schools including Ruskin Elementary School, Kiser Elementary, and Horizon Science Academy Dayton Downtown.
Ownership History
Date
Name
Owned For
Owner Type
Purchase Details
Closed on
Jun 22, 2009
Sold by
Miranda Jose Maria Garcia and Miranda Maria
Bought by
Miranda Quintin M
Current Estimated Value
Purchase Details
Closed on
May 12, 2004
Sold by
Bank One Na
Bought by
Miranda Jose Maria Sarcia and Miranda Maria
Purchase Details
Closed on
Mar 16, 2004
Sold by
Clutter Jean
Bought by
Bank One Na
Purchase Details
Closed on
Dec 22, 1999
Sold by
Horizon Investments Inc
Bought by
Clutter Jean
Home Financials for this Owner
Home Financials are based on the most recent Mortgage that was taken out on this home.
Original Mortgage
$41,250
Interest Rate
7.69%
Purchase Details
Closed on
Nov 24, 1997
Sold by
United Companies Lending Corp
Bought by
Horizon Investments Inc
Purchase Details
Closed on
Oct 28, 1997
Sold by
Haines Gary and Lowe William
Bought by
United Companies Lending Corp
Purchase Details
Closed on
May 20, 1996
Sold by
Copeland R V and Copeland Janie C
Bought by
Lowe William
Purchase Details
Closed on
May 16, 1996
Sold by
Lowe Elizabeth Ann
Bought by
Wilcox Michael W and Wilcox Saundra A
Create a Home Valuation Report for This Property
The Home Valuation Report is an in-depth analysis detailing your home's value as well as a comparison with similar homes in the area
Home Values in the Area
Average Home Value in this Area
Purchase History
| Date | Buyer | Sale Price | Title Company |
|---|---|---|---|
| Miranda Quintin M | -- | Attorney | |
| Miranda Jose Maria Sarcia | $15,000 | -- | |
| Bank One Na | $22,000 | -- | |
| Clutter Jean | $16,800 | -- | |
| Horizon Investments Inc | $7,500 | -- | |
| United Companies Lending Corp | $14,600 | -- | |
| Lowe William | $18,600 | -- | |
| Wilcox Michael W | -- | -- |
Source: Public Records
Mortgage History
| Date | Status | Borrower | Loan Amount |
|---|---|---|---|
| Previous Owner | Clutter Jean | $41,250 |
Source: Public Records
Tax History
| Year | Tax Paid | Tax Assessment Tax Assessment Total Assessment is a certain percentage of the fair market value that is determined by local assessors to be the total taxable value of land and additions on the property. | Land | Improvement |
|---|---|---|---|---|
| 2025 | $970 | $16,190 | $1,830 | $14,360 |
| 2024 | $946 | $16,190 | $1,830 | $14,360 |
| 2023 | $946 | $16,190 | $1,830 | $14,360 |
| 2022 | $880 | $11,630 | $1,320 | $10,310 |
| 2021 | $875 | $11,630 | $1,320 | $10,310 |
| 2020 | $874 | $11,630 | $1,320 | $10,310 |
| 2019 | $596 | $7,020 | $1,320 | $5,700 |
| 2018 | $597 | $7,020 | $1,320 | $5,700 |
| 2017 | $592 | $7,020 | $1,320 | $5,700 |
| 2016 | $650 | $7,360 | $1,320 | $6,040 |
| 2015 | $872 | $10,610 | $1,320 | $9,290 |
| 2014 | $872 | $10,610 | $1,320 | $9,290 |
| 2012 | -- | $9,230 | $2,160 | $7,070 |
Source: Public Records
Map
Nearby Homes
- 60 Bell St
- 2101 E 4th St
- 44 Bell St
- 118 Linden Ave
- 2265 E 5th St
- 2341 E 5th St
- 0 Linden Ave
- 30 Brenner Ave
- 76 Huffman Ave Unit 76, 76 1/2, 78
- 425 Huffman Ave
- 10 Centre St
- 62 Brenner Ave
- 41 Boltin St
- 20 S Philadelphia St
- 639 Huffman Ave
- 29 S June St
- 42 S Monmouth St
- 140 S Terry St
- 108 Samuel St
- 755 Huffman Ave
Your Personal Tour Guide
Ask me questions while you tour the home.