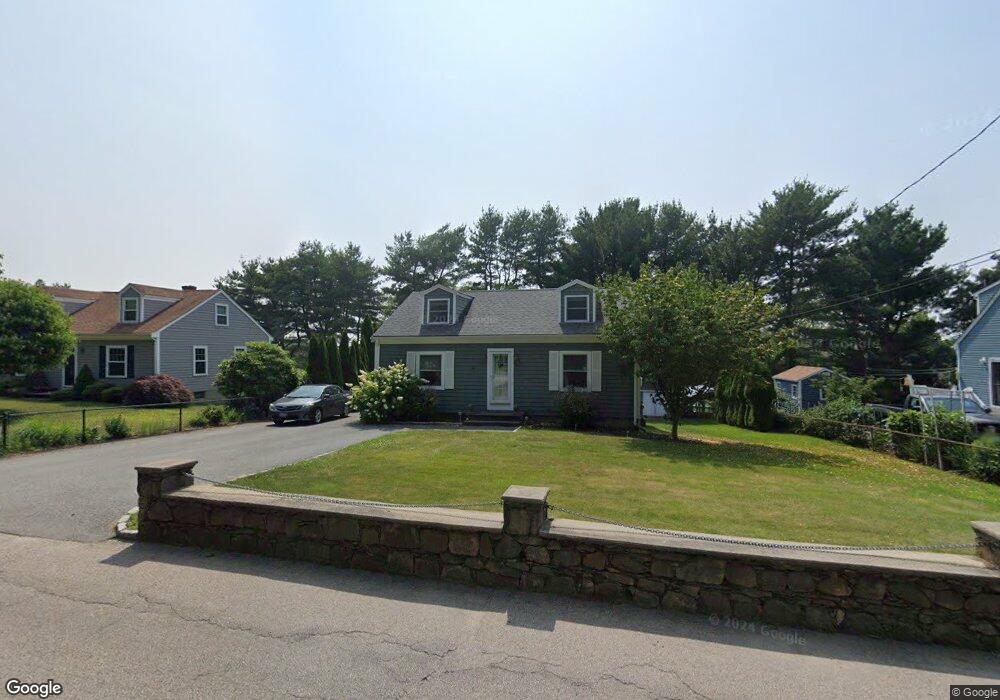
59 Sherry Ave Bristol, RI 02809
Mount Hope High School NeighborhoodEstimated Value: $444,141 - $545,000
3
Beds
1
Bath
1,326
Sq Ft
$373/Sq Ft
Est. Value
About This Home
This home is located at 59 Sherry Ave, Bristol, RI 02809 and is currently estimated at $494,785, approximately $373 per square foot. 59 Sherry Ave is a home located in Bristol County with nearby schools including Mt. Hope High School, Our Lady of Mt. Carmel School, and East Bay Career Academy.
Ownership History
Date
Name
Owned For
Owner Type
Purchase Details
Closed on
Aug 16, 2021
Sold by
Merryman Anthony C
Bought by
Merryman Jodi L
Current Estimated Value
Home Financials for this Owner
Home Financials are based on the most recent Mortgage that was taken out on this home.
Original Mortgage
$270,240
Outstanding Balance
$245,732
Interest Rate
2.9%
Mortgage Type
Purchase Money Mortgage
Estimated Equity
$249,053
Purchase Details
Closed on
Nov 17, 2015
Sold by
Merryman Elaine A
Bought by
Merryman Anthony C
Home Financials for this Owner
Home Financials are based on the most recent Mortgage that was taken out on this home.
Original Mortgage
$190,000
Interest Rate
3.87%
Purchase Details
Closed on
Mar 22, 2004
Sold by
Merryman Elaine and Vincent Patricia
Bought by
Merryman Elaine
Home Financials for this Owner
Home Financials are based on the most recent Mortgage that was taken out on this home.
Original Mortgage
$130,000
Interest Rate
5.71%
Mortgage Type
Purchase Money Mortgage
Create a Home Valuation Report for This Property
The Home Valuation Report is an in-depth analysis detailing your home's value as well as a comparison with similar homes in the area
Home Values in the Area
Average Home Value in this Area
Purchase History
| Date | Buyer | Sale Price | Title Company |
|---|---|---|---|
| Merryman Jodi L | $337,800 | None Available | |
| Merryman Anthony C | $237,500 | -- | |
| Merryman Elaine | $103,500 | -- |
Source: Public Records
Mortgage History
| Date | Status | Borrower | Loan Amount |
|---|---|---|---|
| Open | Merryman Jodi L | $270,240 | |
| Previous Owner | Merryman Elaine | $190,000 | |
| Previous Owner | Merryman Elaine | $130,000 |
Source: Public Records
Tax History
| Year | Tax Paid | Tax Assessment Tax Assessment Total Assessment is a certain percentage of the fair market value that is determined by local assessors to be the total taxable value of land and additions on the property. | Land | Improvement |
|---|---|---|---|---|
| 2025 | $4,403 | $318,600 | $142,100 | $176,500 |
| 2024 | $4,403 | $318,600 | $142,100 | $176,500 |
| 2023 | $4,256 | $318,600 | $142,100 | $176,500 |
| 2022 | $4,142 | $318,600 | $142,100 | $176,500 |
| 2021 | $3,571 | $248,300 | $116,800 | $131,500 |
| 2020 | $3,494 | $248,300 | $116,800 | $131,500 |
| 2019 | $3,407 | $248,300 | $116,800 | $131,500 |
| 2018 | $3,762 | $244,600 | $123,300 | $121,300 |
| 2017 | $3,273 | $219,400 | $111,400 | $108,000 |
| 2016 | $3,241 | $219,400 | $111,400 | $108,000 |
| 2015 | $3,008 | $214,400 | $111,400 | $103,000 |
| 2014 | $2,970 | $227,390 | $134,600 | $92,790 |
Source: Public Records
Map
Nearby Homes
- 85 Bay View Ave Unit 3
- 85 Bay View Ave Unit 2
- 2 Wilson St
- 2 Chilton St
- 21 Monroe Ave
- 413 High St
- 15 Bourne St
- 15 Rosedale Dr
- 236 State St
- 556 Metacom Ave
- 26 Roosevelt Dr
- 44 Bradford St Unit 49
- 30 Sowams Dr
- 25 Massasoit Ave
- 27 Massasoit Ave
- 32 Massasoit Ave
- 30 Massasoit Ave
- 78 State St
- 18 State St Unit 5 (3rd Floor East)
- 423 Hope St Unit 1A
Your Personal Tour Guide
Ask me questions while you tour the home.