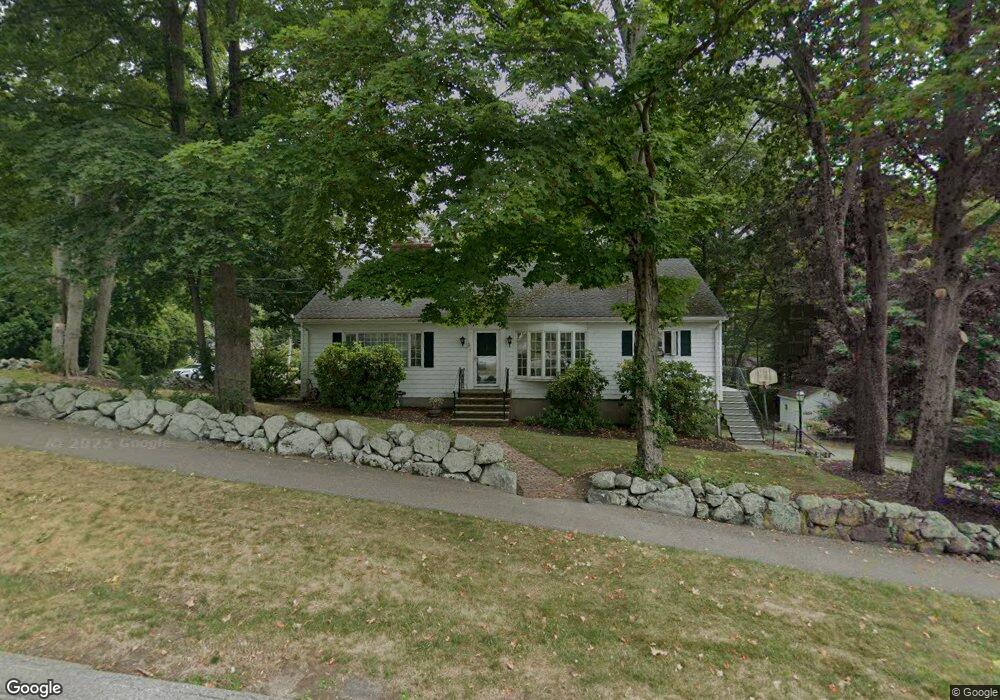
59 Summer St Danvers, MA 01923
Estimated Value: $741,989 - $976,000
3
Beds
3
Baths
1,940
Sq Ft
$425/Sq Ft
Est. Value
About This Home
This home is located at 59 Summer St, Danvers, MA 01923 and is currently estimated at $824,997, approximately $425 per square foot. 59 Summer St is a home located in Essex County with nearby schools including Danvers High School, St. Mary of the Annunciation School, and St. John's Prep.
Ownership History
Date
Name
Owned For
Owner Type
Purchase Details
Closed on
Apr 23, 2020
Sold by
Trott Delano B and Trott Jane S
Bought by
Delano B & Jane S Trott Ret
Current Estimated Value
Purchase Details
Closed on
Oct 23, 1991
Sold by
Sims Michael J and Sims Mary Lou
Bought by
Trott Delano B and Trott Jane S
Purchase Details
Closed on
Apr 24, 1989
Sold by
Ackerman Richard
Bought by
Sims Michael J
Create a Home Valuation Report for This Property
The Home Valuation Report is an in-depth analysis detailing your home's value as well as a comparison with similar homes in the area
Home Values in the Area
Average Home Value in this Area
Purchase History
| Date | Buyer | Sale Price | Title Company |
|---|---|---|---|
| Delano B & Jane S Trott Ret | -- | None Available | |
| Trott Delano B | $219,000 | -- | |
| Sims Michael J | $225,000 | -- | |
| Sims Michael J | $225,000 | -- |
Source: Public Records
Mortgage History
| Date | Status | Borrower | Loan Amount |
|---|---|---|---|
| Previous Owner | Sims Michael J | $200,000 | |
| Previous Owner | Sims Michael J | $160,000 | |
| Previous Owner | Sims Michael J | $139,000 |
Source: Public Records
Tax History
| Year | Tax Paid | Tax Assessment Tax Assessment Total Assessment is a certain percentage of the fair market value that is determined by local assessors to be the total taxable value of land and additions on the property. | Land | Improvement |
|---|---|---|---|---|
| 2025 | $7,068 | $643,100 | $397,700 | $245,400 |
| 2024 | $7,037 | $633,400 | $391,100 | $242,300 |
| 2023 | $6,881 | $585,600 | $358,000 | $227,600 |
| 2022 | $6,636 | $524,200 | $318,200 | $206,000 |
| 2021 | $6,491 | $486,200 | $314,200 | $172,000 |
| 2020 | $6,350 | $486,200 | $314,200 | $172,000 |
| 2019 | $6,070 | $457,100 | $285,000 | $172,100 |
| 2018 | $5,944 | $439,000 | $285,000 | $154,000 |
| 2017 | $5,633 | $397,000 | $245,300 | $151,700 |
| 2016 | $5,338 | $375,900 | $232,000 | $143,900 |
| 2015 | $5,128 | $343,900 | $212,100 | $131,800 |
Source: Public Records
Map
Nearby Homes
Your Personal Tour Guide
Ask me questions while you tour the home.