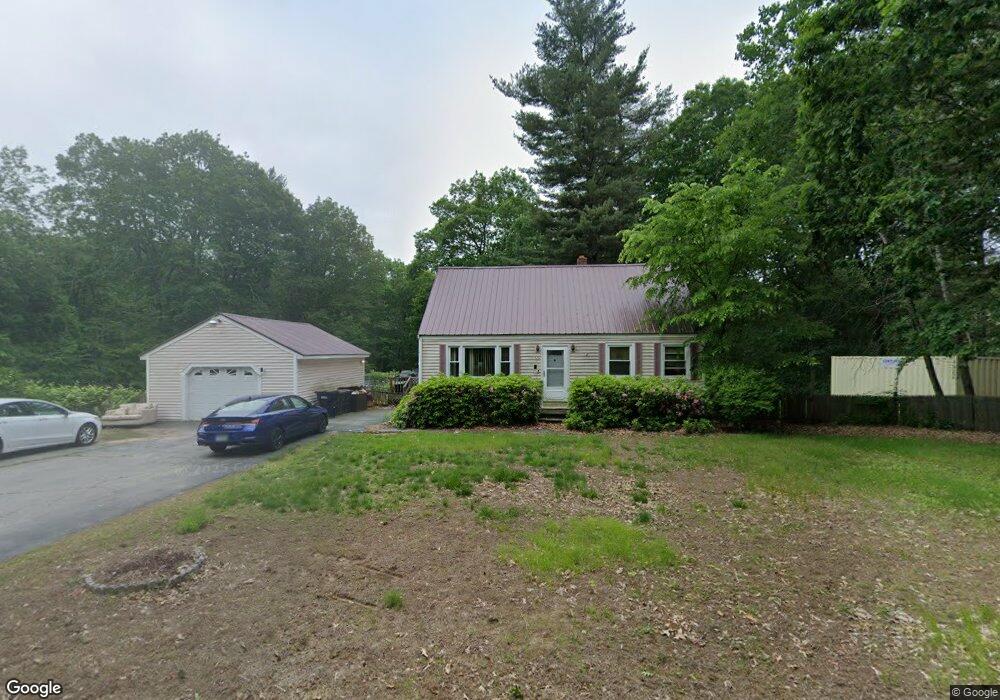
59 Tallant Rd Pelham, NH 03076
Estimated Value: $536,000 - $599,000
3
Beds
2
Baths
1,469
Sq Ft
$384/Sq Ft
Est. Value
About This Home
This home is located at 59 Tallant Rd, Pelham, NH 03076 and is currently estimated at $564,313, approximately $384 per square foot. 59 Tallant Rd is a home with nearby schools including Pelham Elementary School, Pelham Memorial School, and Pelham High School.
Ownership History
Date
Name
Owned For
Owner Type
Purchase Details
Closed on
Aug 30, 1996
Sold by
Jarek Walter F and Jarek Mary
Bought by
Belanger Jamie
Current Estimated Value
Home Financials for this Owner
Home Financials are based on the most recent Mortgage that was taken out on this home.
Original Mortgage
$112,100
Interest Rate
8.18%
Create a Home Valuation Report for This Property
The Home Valuation Report is an in-depth analysis detailing your home's value as well as a comparison with similar homes in the area
Home Values in the Area
Average Home Value in this Area
Purchase History
| Date | Buyer | Sale Price | Title Company |
|---|---|---|---|
| Belanger Jamie | $118,000 | -- |
Source: Public Records
Mortgage History
| Date | Status | Borrower | Loan Amount |
|---|---|---|---|
| Open | Belanger Jamie | $159,485 | |
| Closed | Belanger Jamie | $88,500 | |
| Closed | Belanger Jamie | $112,100 |
Source: Public Records
Tax History Compared to Growth
Tax History
| Year | Tax Paid | Tax Assessment Tax Assessment Total Assessment is a certain percentage of the fair market value that is determined by local assessors to be the total taxable value of land and additions on the property. | Land | Improvement |
|---|---|---|---|---|
| 2024 | $6,087 | $331,900 | $142,300 | $189,600 |
| 2023 | $6,037 | $331,900 | $142,300 | $189,600 |
| 2022 | $5,782 | $331,900 | $142,300 | $189,600 |
| 2021 | $5,297 | $331,900 | $142,300 | $189,600 |
| 2020 | $5,472 | $270,900 | $113,400 | $157,500 |
| 2019 | $5,255 | $270,900 | $113,400 | $157,500 |
| 2018 | $5,408 | $252,000 | $113,400 | $138,600 |
| 2017 | $5,405 | $252,000 | $113,400 | $138,600 |
| 2016 | $5,288 | $252,400 | $113,400 | $139,000 |
| 2015 | $5,068 | $217,900 | $107,900 | $110,000 |
| 2014 | $4,983 | $217,900 | $107,900 | $110,000 |
| 2013 | $4,983 | $217,900 | $107,900 | $110,000 |
Source: Public Records
Map
Nearby Homes