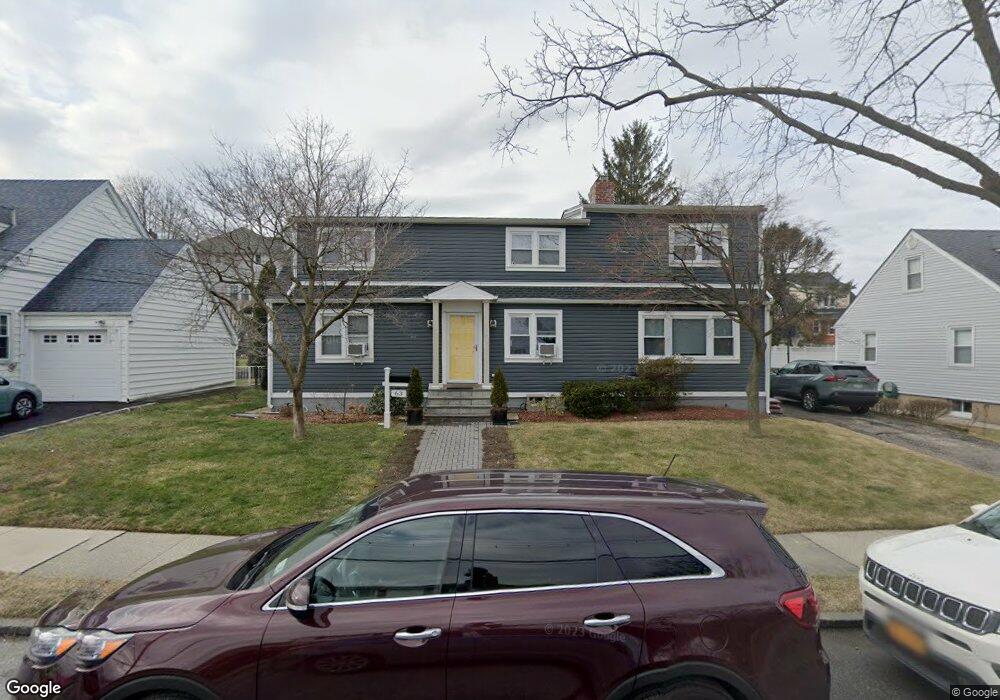
59 Thomas Place Yonkers, NY 10701
Bryn Mawr Park NeighborhoodEstimated Value: $835,010 - $964,000
5
Beds
2
Baths
2,328
Sq Ft
$389/Sq Ft
Est. Value
About This Home
This home is located at 59 Thomas Place, Yonkers, NY 10701 and is currently estimated at $906,253, approximately $389 per square foot. 59 Thomas Place is a home located in Westchester County with nearby schools including Sacred Heart Grade School, Andalusia School, and Sacred Heart High School.
Ownership History
Date
Name
Owned For
Owner Type
Purchase Details
Closed on
Sep 15, 2022
Sold by
Montero Silvia P and Guzman Fausto
Bought by
Zhang Jun Sheng and Lu Xiu Qin
Current Estimated Value
Home Financials for this Owner
Home Financials are based on the most recent Mortgage that was taken out on this home.
Original Mortgage
$200,000
Outstanding Balance
$191,644
Interest Rate
5.63%
Mortgage Type
New Conventional
Estimated Equity
$714,609
Purchase Details
Closed on
Sep 1, 2022
Sold by
Montero Silvia P and Guzman Fausto
Bought by
Zhang Jun Sheng and Lu Xiu Qin
Home Financials for this Owner
Home Financials are based on the most recent Mortgage that was taken out on this home.
Original Mortgage
$200,000
Outstanding Balance
$191,644
Interest Rate
5.63%
Mortgage Type
New Conventional
Estimated Equity
$714,609
Purchase Details
Closed on
May 7, 2013
Sold by
Chapa Luis and Montero Vilma
Bought by
Montero Silvia P and Guzman Fausto
Create a Home Valuation Report for This Property
The Home Valuation Report is an in-depth analysis detailing your home's value as well as a comparison with similar homes in the area
Home Values in the Area
Average Home Value in this Area
Purchase History
| Date | Buyer | Sale Price | Title Company |
|---|---|---|---|
| Zhang Jun Sheng | $850,000 | Vp Abstract Services Inc | |
| Zhang Jun Sheng | $850,000 | Stewart Title Company | |
| Montero Silvia P | -- | The Judicial Title Ins Age |
Source: Public Records
Mortgage History
| Date | Status | Borrower | Loan Amount |
|---|---|---|---|
| Open | Zhang Jun Sheng | $200,000 |
Source: Public Records
Tax History Compared to Growth
Tax History
| Year | Tax Paid | Tax Assessment Tax Assessment Total Assessment is a certain percentage of the fair market value that is determined by local assessors to be the total taxable value of land and additions on the property. | Land | Improvement |
|---|---|---|---|---|
| 2024 | $2,067 | $11,600 | $5,300 | $6,300 |
| 2023 | $2,056 | $11,600 | $5,300 | $6,300 |
| 2022 | $2,043 | $11,600 | $5,300 | $6,300 |
| 2021 | $9,356 | $12,000 | $5,300 | $6,700 |
| 2020 | $9,264 | $12,000 | $5,300 | $6,700 |
| 2019 | $11,112 | $12,000 | $5,300 | $6,700 |
| 2018 | $8,569 | $12,000 | $5,300 | $6,700 |
| 2017 | $0 | $12,000 | $5,300 | $6,700 |
| 2016 | $9,746 | $12,000 | $5,300 | $6,700 |
| 2015 | -- | $12,000 | $5,300 | $6,700 |
| 2014 | -- | $14,800 | $5,300 | $9,500 |
Source: Public Records
Map
Nearby Homes
- 166 Lockwood Ave
- 55 Ramsey Ave
- 7 Victoria Ln
- 1 Victor Ln
- 219 Mile Square Rd
- 64 AKA 66 Pocono Ave
- 66 Pocono Ave
- 140 Ramsey Ave
- 49 Bryn Mawr Terrace
- 116 Gavin St
- 62 Fortfield Ave
- 419 Palmer Rd
- 255 Glenhill Ave
- 96 Rossiter Ave
- 54 Albemarle Place
- 42 Homewood Ave
- 5 Granite Place
- 1 Granite Place
- 8 Elicar Terrace
- 70 Normandy Rd
- 63 Thomas Place
- 55 Thomas Place
- 65 Thomas Place
- 51 Thomas Place
- 174 Briggs Ave
- 29 Thomas Place
- 69 Thomas Place
- 2 Armstrong Ave
- 170 Briggs Ave
- 178 Briggs Ave
- 166 Briggs Ave
- 23 Montgomery Ave Unit 3
- 6 Armstrong Ave
- 182 Briggs Ave
- 3 Armstrong Ave Unit 2
- 3 Armstrong Ave
- 73 Thomas Place
- 17 Montgomery Ave
- 186 Briggs Ave
- 186 Briggs Ave Unit 2