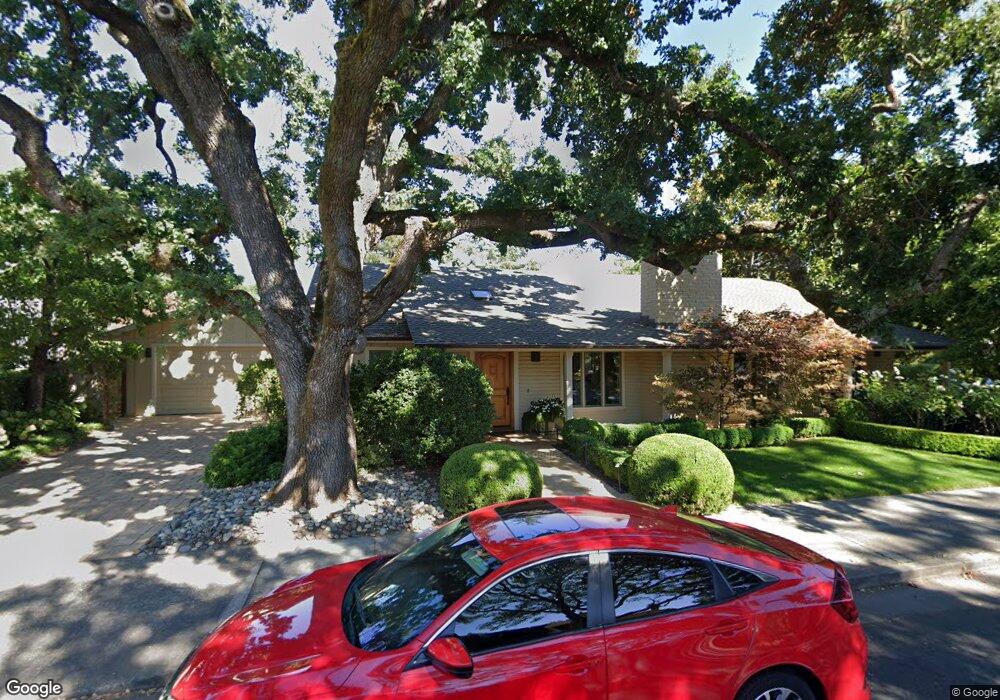
590 4th St E Sonoma, CA 95476
Estimated Value: $1,687,000 - $1,760,000
3
Beds
2
Baths
2,033
Sq Ft
$844/Sq Ft
Est. Value
About This Home
This home is located at 590 4th St E, Sonoma, CA 95476 and is currently estimated at $1,715,810, approximately $843 per square foot. 590 4th St E is a home located in Sonoma County with nearby schools including Prestwood Elementary School, Adele Harrison Middle School, and Creekside High School.
Ownership History
Date
Name
Owned For
Owner Type
Purchase Details
Closed on
Jul 11, 2007
Sold by
Ruggles Allison
Bought by
Ruggles Robert N and Ruggles Allison
Current Estimated Value
Purchase Details
Closed on
May 27, 2005
Sold by
Ruggles Robert N and Robert N Ruggles Trust
Bought by
Ruggles Allison
Purchase Details
Closed on
Mar 23, 2004
Sold by
Revx-269 Inc
Bought by
Ruggles Robert N and Robert N Ruggles Trust
Purchase Details
Closed on
Sep 24, 2003
Sold by
Barnett Grant and Barnett Phyllis
Bought by
Revx-269 Inc
Purchase Details
Closed on
Aug 25, 1994
Sold by
White Alan B and White Sandra J
Bought by
Barnett Kelso Grant and Barnett Phyllis R
Home Financials for this Owner
Home Financials are based on the most recent Mortgage that was taken out on this home.
Original Mortgage
$308,800
Interest Rate
6.35%
Create a Home Valuation Report for This Property
The Home Valuation Report is an in-depth analysis detailing your home's value as well as a comparison with similar homes in the area
Home Values in the Area
Average Home Value in this Area
Purchase History
| Date | Buyer | Sale Price | Title Company |
|---|---|---|---|
| Ruggles Robert N | -- | None Available | |
| Ruggles Allison | -- | -- | |
| Ruggles Robert N | $917,500 | Fidelity National Title Co | |
| Revx-269 Inc | $727,500 | Fidelity Natl Title Co | |
| Barnett Kelso Grant | $343,500 | First American Title |
Source: Public Records
Mortgage History
| Date | Status | Borrower | Loan Amount |
|---|---|---|---|
| Previous Owner | Barnett Kelso Grant | $308,800 | |
| Closed | Revx-269 Inc | $0 |
Source: Public Records
Tax History
| Year | Tax Paid | Tax Assessment Tax Assessment Total Assessment is a certain percentage of the fair market value that is determined by local assessors to be the total taxable value of land and additions on the property. | Land | Improvement |
|---|---|---|---|---|
| 2025 | $16,882 | $1,411,973 | $604,252 | $807,721 |
| 2024 | $16,882 | $1,384,288 | $592,404 | $791,884 |
| 2023 | $16,882 | $1,357,146 | $580,789 | $776,357 |
| 2022 | $16,874 | $1,330,536 | $569,401 | $761,135 |
| 2021 | $16,287 | $1,304,448 | $558,237 | $746,211 |
| 2020 | $16,243 | $1,291,073 | $552,513 | $738,560 |
| 2019 | $15,885 | $1,265,759 | $541,680 | $724,079 |
| 2018 | $16,288 | $1,240,941 | $531,059 | $709,882 |
| 2017 | $15,320 | $1,216,610 | $520,647 | $695,963 |
| 2016 | $14,707 | $1,192,756 | $510,439 | $682,317 |
| 2015 | $14,235 | $1,174,840 | $502,772 | $672,068 |
| 2014 | $13,825 | $1,151,828 | $492,924 | $658,904 |
Source: Public Records
Map
Nearby Homes
Your Personal Tour Guide
Ask me questions while you tour the home.