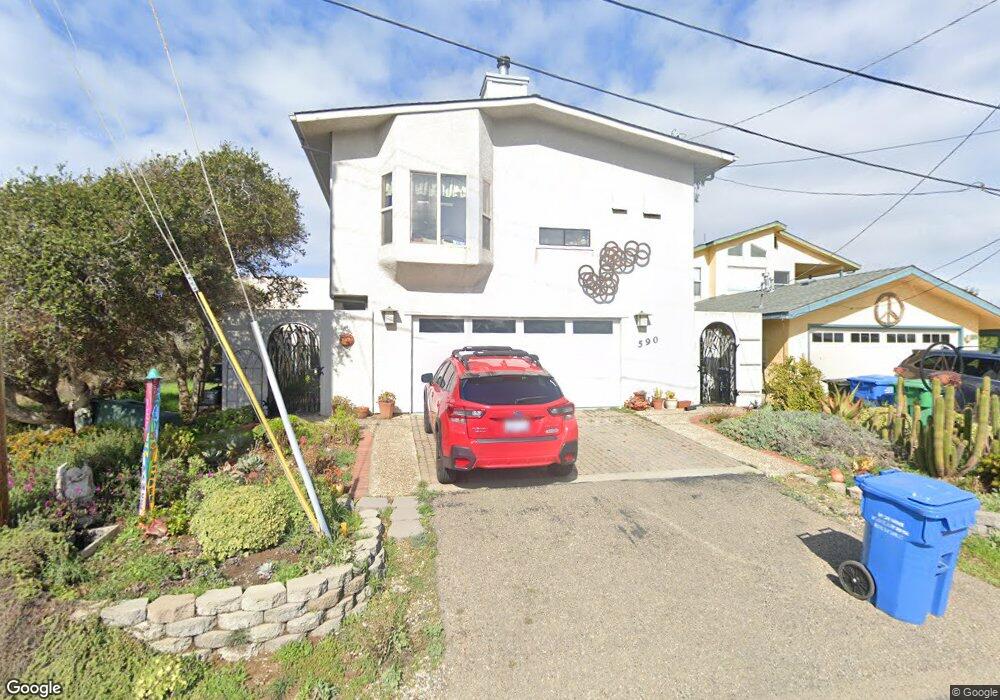
590 Ash St Los Osos, CA 93402
Estimated Value: $830,870 - $1,111,000
2
Beds
2
Baths
1,983
Sq Ft
$483/Sq Ft
Est. Value
About This Home
This home is located at 590 Ash St, Los Osos, CA 93402 and is currently estimated at $957,468, approximately $482 per square foot. 590 Ash St is a home located in San Luis Obispo County with nearby schools including Monarch Grove Elementary School, Los Osos Middle School, and Morro Bay High School.
Ownership History
Date
Name
Owned For
Owner Type
Purchase Details
Closed on
May 30, 2017
Sold by
Sparta Martha Jane and The Sparta Family Trust
Bought by
Sparta Martha Jane and The Sparta Family Trust
Current Estimated Value
Purchase Details
Closed on
Jan 14, 2016
Sold by
Sparta Martha Jane and The Sparta Family Trust
Bought by
Sparta Martha Jane and The Sparta Family Trust
Home Financials for this Owner
Home Financials are based on the most recent Mortgage that was taken out on this home.
Original Mortgage
$64,000
Interest Rate
3.92%
Mortgage Type
Credit Line Revolving
Purchase Details
Closed on
Nov 4, 2013
Sold by
Sparta Philip Clifford and Sparta Martha Jane
Bought by
Sparta Philip Clifford and Sparta Martha Jane
Create a Home Valuation Report for This Property
The Home Valuation Report is an in-depth analysis detailing your home's value as well as a comparison with similar homes in the area
Home Values in the Area
Average Home Value in this Area
Purchase History
| Date | Buyer | Sale Price | Title Company |
|---|---|---|---|
| Sparta Martha Jane | -- | None Available | |
| Sparta Martha Jane | -- | First American Title Company | |
| Sparta Philip Clifford | -- | None Available |
Source: Public Records
Mortgage History
| Date | Status | Borrower | Loan Amount |
|---|---|---|---|
| Closed | Sparta Martha Jane | $64,000 |
Source: Public Records
Tax History
| Year | Tax Paid | Tax Assessment Tax Assessment Total Assessment is a certain percentage of the fair market value that is determined by local assessors to be the total taxable value of land and additions on the property. | Land | Improvement |
|---|---|---|---|---|
| 2025 | $4,825 | $223,488 | $42,103 | $181,385 |
| 2024 | $4,693 | $219,107 | $41,278 | $177,829 |
| 2023 | $4,693 | $214,812 | $40,469 | $174,343 |
| 2022 | $4,613 | $210,601 | $39,676 | $170,925 |
| 2021 | $4,423 | $206,473 | $38,899 | $167,574 |
| 2020 | $4,215 | $204,357 | $38,501 | $165,856 |
| 2019 | $4,187 | $200,351 | $37,747 | $162,604 |
| 2018 | $4,261 | $196,423 | $37,007 | $159,416 |
| 2017 | $4,206 | $192,573 | $36,282 | $156,291 |
| 2016 | $2,996 | $188,798 | $35,571 | $153,227 |
| 2015 | $2,965 | $185,963 | $35,037 | $150,926 |
| 2014 | $2,796 | $182,321 | $34,351 | $147,970 |
Source: Public Records
Map
Nearby Homes
Your Personal Tour Guide
Ask me questions while you tour the home.