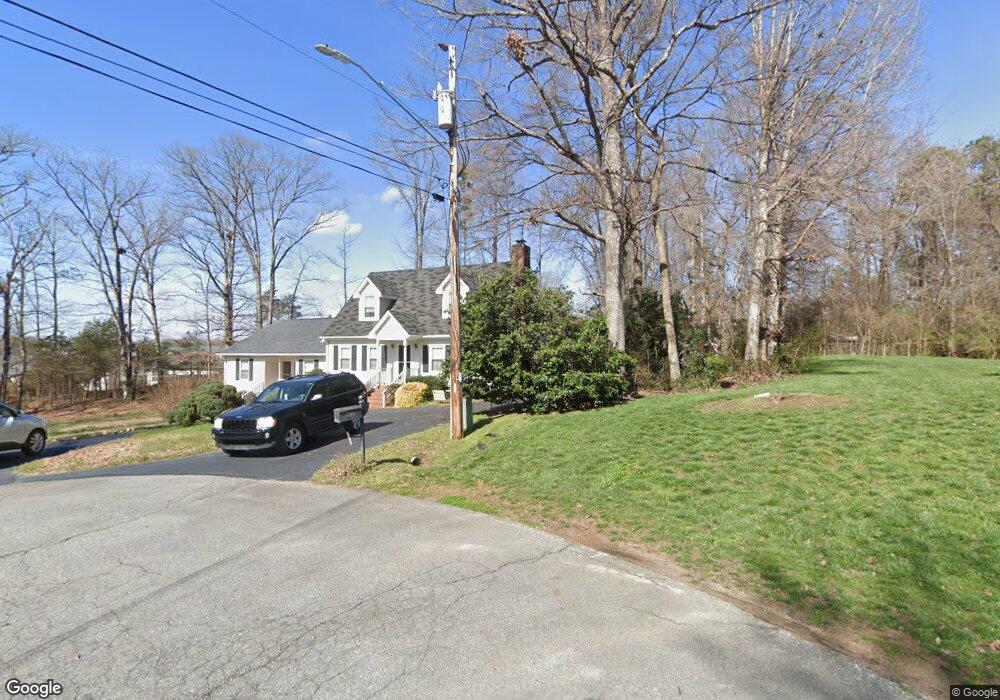
590 Axton Place NW Concord, NC 28027
Estimated Value: $301,000 - $405,000
4
Beds
3
Baths
2,227
Sq Ft
$156/Sq Ft
Est. Value
About This Home
This home is located at 590 Axton Place NW, Concord, NC 28027 and is currently estimated at $347,895, approximately $156 per square foot. 590 Axton Place NW is a home located in Cabarrus County with nearby schools including Weddington Hills Elementary School, Harold E. Winkler Middle School, and Cabarrus Charter Academy.
Ownership History
Date
Name
Owned For
Owner Type
Purchase Details
Closed on
Dec 13, 2022
Sold by
Benham Philip Lance
Bought by
Evans Christine B
Current Estimated Value
Purchase Details
Closed on
Dec 22, 2011
Sold by
Benham Marion
Bought by
Benham Marion and Evans Christine
Purchase Details
Closed on
Jul 24, 2006
Sold by
Hinson Beverly and Hinson Scott
Bought by
Benham Marion
Purchase Details
Closed on
Jun 24, 2005
Sold by
Glass Geoffrey P
Bought by
Hinson Beverly and Winslow Kimberly
Home Financials for this Owner
Home Financials are based on the most recent Mortgage that was taken out on this home.
Original Mortgage
$62,960
Interest Rate
5.66%
Mortgage Type
Purchase Money Mortgage
Purchase Details
Closed on
May 1, 1991
Bought by
Glass Geoffrey P and Glass Wife
Purchase Details
Closed on
Apr 1, 1985
Create a Home Valuation Report for This Property
The Home Valuation Report is an in-depth analysis detailing your home's value as well as a comparison with similar homes in the area
Home Values in the Area
Average Home Value in this Area
Purchase History
| Date | Buyer | Sale Price | Title Company |
|---|---|---|---|
| Evans Christine B | -- | -- | |
| Benham Marion | -- | None Available | |
| Benham Marion | $129,000 | None Available | |
| Hinson Beverly | $79,000 | Chicago Title Insurance Comp | |
| Glass Geoffrey P | $72,500 | -- | |
| -- | $6,000 | -- |
Source: Public Records
Mortgage History
| Date | Status | Borrower | Loan Amount |
|---|---|---|---|
| Previous Owner | Hinson Beverly | $62,960 |
Source: Public Records
Tax History Compared to Growth
Tax History
| Year | Tax Paid | Tax Assessment Tax Assessment Total Assessment is a certain percentage of the fair market value that is determined by local assessors to be the total taxable value of land and additions on the property. | Land | Improvement |
|---|---|---|---|---|
| 2025 | $1,704 | $342,180 | $64,000 | $278,180 |
| 2024 | $1,704 | $342,180 | $64,000 | $278,180 |
| 2023 | $1,326 | $217,330 | $49,000 | $168,330 |
| 2022 | $1,326 | $217,330 | $49,000 | $168,330 |
| 2021 | $1,326 | $217,330 | $49,000 | $168,330 |
| 2020 | $1,326 | $217,330 | $49,000 | $168,330 |
| 2019 | $1,069 | $175,210 | $26,000 | $149,210 |
| 2018 | $1,051 | $175,210 | $26,000 | $149,210 |
| 2017 | $1,034 | $175,210 | $26,000 | $149,210 |
| 2016 | $613 | $168,040 | $26,000 | $142,040 |
| 2015 | $1,983 | $168,040 | $26,000 | $142,040 |
| 2014 | $1,983 | $168,040 | $26,000 | $142,040 |
Source: Public Records
Map
Nearby Homes
- 376 Brookgreen Place NW
- 490 Cavehill Dr NW
- 458 Allen Dr NW
- 456 Allen Dr NW
- 2676 Poplar Cove Dr NW
- 2817 Westfield Ave NW
- 500 Peigler St NW
- 490 Peigler St NW
- 2628 Clipper Ct NW
- 3575 Travis Ln NW
- 699 Kitfox Dr NW
- 733 Earhart St NW
- 234 Candle Ct NW
- 757 Kitfox NW
- 765 Lock Haven Dr NW
- 759 Lock Haven Dr NW
- 763 Lock Haven Dr NW
- 755 Kitfox NW
- 761 Lock Haven Dr NW
- 759 Kitfox NW
- 591 Axton Place NW
- 3004 Dylan Place NW
- 3088 Trimble Cir NW
- 3092 Trimble Cir NW
- 3084 Trimble Cir NW
- 3098 Trimble Cir NW
- 3076 Trimble Cir NW
- 3076 Trimble Cir NW Unit 37
- 2928 Dylan Place NW
- 3008 Dylan Place NW
- 3072 Trimble Cir NW
- 3068 Trimble Cir NW
- 3091 Trimble Cir NW
- 4009 NW Trimble Cir NW
- 4007 Trimble Cir NW
- 4003 Trimble Cir NW Unit 1
- 4003 Trimble Cir NW
- 3060 Trimble Cir NW
- 3087 Trimble Cir NW
- 3083 Trimble Cir NW