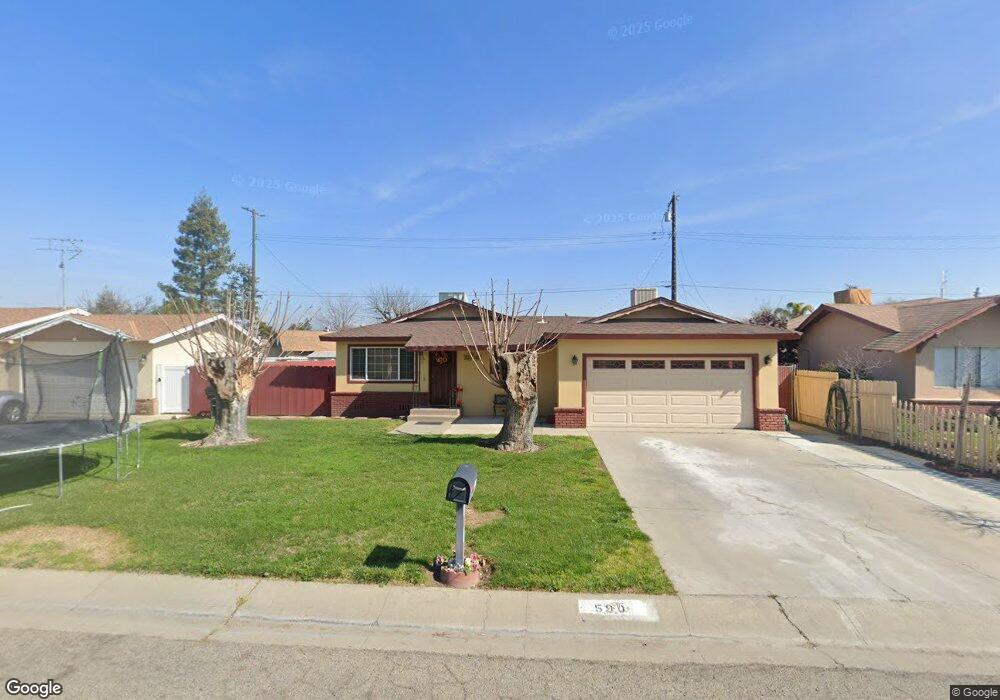
590 Mathew St Porterville, CA 93257
Porterville Northwest NeighborhoodEstimated Value: $237,000 - $310,000
--
Bed
2
Baths
1,188
Sq Ft
$229/Sq Ft
Est. Value
About This Home
This home is located at 590 Mathew St, Porterville, CA 93257 and is currently estimated at $272,250, approximately $229 per square foot. 590 Mathew St is a home located in Tulare County with nearby schools including Jim Maples Academy, Burton Middle School, and Monache High School.
Ownership History
Date
Name
Owned For
Owner Type
Purchase Details
Closed on
Jan 23, 2001
Sold by
Garcia John R
Bought by
Hernandez Frank J and Hernandez Lisa S
Current Estimated Value
Home Financials for this Owner
Home Financials are based on the most recent Mortgage that was taken out on this home.
Original Mortgage
$79,192
Outstanding Balance
$28,031
Interest Rate
6.98%
Mortgage Type
FHA
Estimated Equity
$244,219
Purchase Details
Closed on
Sep 10, 1998
Sold by
Garcia Lupe R
Bought by
Garcia John R
Home Financials for this Owner
Home Financials are based on the most recent Mortgage that was taken out on this home.
Original Mortgage
$70,322
Interest Rate
6.79%
Mortgage Type
FHA
Purchase Details
Closed on
Sep 13, 1994
Sold by
Alston Felix Scott
Bought by
Garcia John R and Garcia Lupe R
Home Financials for this Owner
Home Financials are based on the most recent Mortgage that was taken out on this home.
Original Mortgage
$67,050
Interest Rate
5.87%
Create a Home Valuation Report for This Property
The Home Valuation Report is an in-depth analysis detailing your home's value as well as a comparison with similar homes in the area
Home Values in the Area
Average Home Value in this Area
Purchase History
| Date | Buyer | Sale Price | Title Company |
|---|---|---|---|
| Hernandez Frank J | $80,000 | First American Title Co | |
| Garcia John R | -- | First American Title Co | |
| Garcia John R | $74,500 | First American Title Ins Co |
Source: Public Records
Mortgage History
| Date | Status | Borrower | Loan Amount |
|---|---|---|---|
| Open | Hernandez Frank J | $79,192 | |
| Previous Owner | Garcia John R | $70,322 | |
| Previous Owner | Garcia John R | $67,050 | |
| Closed | Hernandez Frank J | $2,397 |
Source: Public Records
Tax History Compared to Growth
Tax History
| Year | Tax Paid | Tax Assessment Tax Assessment Total Assessment is a certain percentage of the fair market value that is determined by local assessors to be the total taxable value of land and additions on the property. | Land | Improvement |
|---|---|---|---|---|
| 2025 | $1,265 | $120,400 | $37,670 | $82,730 |
| 2024 | $1,265 | $118,040 | $36,932 | $81,108 |
| 2023 | $1,268 | $115,726 | $36,208 | $79,518 |
| 2022 | $1,219 | $113,458 | $35,499 | $77,959 |
| 2021 | $1,201 | $111,233 | $34,803 | $76,430 |
| 2020 | $1,179 | $110,092 | $34,446 | $75,646 |
| 2019 | $1,178 | $107,934 | $33,771 | $74,163 |
| 2018 | $1,126 | $105,818 | $33,109 | $72,709 |
| 2017 | $1,108 | $103,743 | $32,460 | $71,283 |
| 2016 | $1,056 | $101,709 | $31,824 | $69,885 |
| 2015 | $1,018 | $100,181 | $31,346 | $68,835 |
| 2014 | $1,018 | $98,219 | $30,732 | $67,487 |
Source: Public Records
Map
Nearby Homes
- 2070 W Harrison Ave
- 595 N Salisbury St
- 313 Balmoral Dr
- 1771 W Aurora Ct
- 1730 W Grand Ave
- 2300 W Morton Ave Unit 163
- 2300 W Morton Ave Unit 135
- 1690 Memory Ln
- 2219 W Theta Ave
- 2434 W Kanai Ave
- 575 N Brandy Way
- 1750 W Terry Cir
- 22346 W Thurman Ave
- 2179 W Della Ave
- Sydney Plan at Laurelwood
- Carlton Plan at Laurelwood
- Carmel Plan at Laurelwood
- Aspen with Loft Plan at Laurelwood
- Aspen Plan at Laurelwood
- Hawthorne Plan at Brookside
- 596 Mathew St
- 582 Mathew St
- 579 N Walch St
- 573 N Walch St
- 570 Mathew St
- 583 N Walch St
- 1961 White Chapel Ln
- 1951 White Chapel Ln
- 597 Mathew St
- 563 N Walch St
- 603 Mathew St
- 587 Mathew St
- 1941 White Chapel Ln
- 577 Mathew St
- 560 Mathew St
- 1931 White Chapel Ln
- 1981 White Chapel Ln
- 2212 W White Chapel Ln
- 1984 W White Chapel Ln
- 557 Mathew St