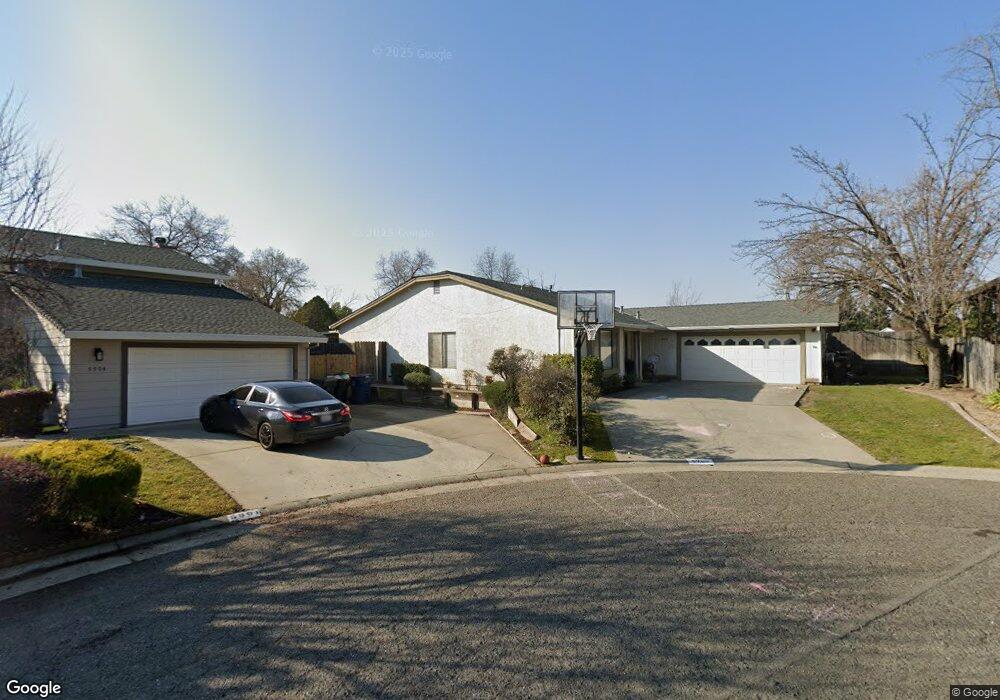
5900 Fire Stick Ct Citrus Heights, CA 95621
Estimated Value: $382,000 - $584,000
3
Beds
2
Baths
1,941
Sq Ft
$270/Sq Ft
Est. Value
About This Home
This home is located at 5900 Fire Stick Ct, Citrus Heights, CA 95621 and is currently estimated at $524,253, approximately $270 per square foot. 5900 Fire Stick Ct is a home located in Sacramento County with nearby schools including Arlington Heights Elementary School, Sylvan Middle School, and Mesa Verde High School.
Ownership History
Date
Name
Owned For
Owner Type
Purchase Details
Closed on
Aug 28, 2017
Sold by
Stephens James and Stephens James T
Bought by
Stephens James
Current Estimated Value
Home Financials for this Owner
Home Financials are based on the most recent Mortgage that was taken out on this home.
Original Mortgage
$222,556
Outstanding Balance
$185,950
Interest Rate
3.92%
Mortgage Type
New Conventional
Estimated Equity
$338,303
Purchase Details
Closed on
Jun 5, 2002
Sold by
Stephens James T
Bought by
Stephens Ginette M
Purchase Details
Closed on
Jun 4, 2002
Sold by
Stephens Ginette M
Bought by
Stephens James T
Purchase Details
Closed on
Dec 23, 1998
Sold by
Stephens Eleanor F
Bought by
Stephens James T and Stephens Ginette M
Home Financials for this Owner
Home Financials are based on the most recent Mortgage that was taken out on this home.
Original Mortgage
$111,750
Interest Rate
6.82%
Create a Home Valuation Report for This Property
The Home Valuation Report is an in-depth analysis detailing your home's value as well as a comparison with similar homes in the area
Home Values in the Area
Average Home Value in this Area
Purchase History
| Date | Buyer | Sale Price | Title Company |
|---|---|---|---|
| Stephens James | -- | Old Republic Title Company | |
| Stephens Ginette M | -- | -- | |
| Stephens James T | -- | -- | |
| Stephens James T | -- | Fidelity National Title Co |
Source: Public Records
Mortgage History
| Date | Status | Borrower | Loan Amount |
|---|---|---|---|
| Open | Stephens James | $222,556 | |
| Closed | Stephens James T | $111,750 |
Source: Public Records
Tax History Compared to Growth
Tax History
| Year | Tax Paid | Tax Assessment Tax Assessment Total Assessment is a certain percentage of the fair market value that is determined by local assessors to be the total taxable value of land and additions on the property. | Land | Improvement |
|---|---|---|---|---|
| 2025 | $3,167 | $266,738 | $55,173 | $211,565 |
| 2024 | $3,167 | $261,509 | $54,092 | $207,417 |
| 2023 | $3,087 | $256,382 | $53,032 | $203,350 |
| 2022 | $3,071 | $251,356 | $51,993 | $199,363 |
| 2021 | $3,020 | $246,428 | $50,974 | $195,454 |
| 2020 | $2,964 | $243,902 | $50,452 | $193,450 |
| 2019 | $2,905 | $239,120 | $49,463 | $189,657 |
| 2018 | $2,872 | $234,433 | $48,494 | $185,939 |
| 2017 | $2,993 | $229,838 | $47,544 | $182,294 |
| 2016 | $2,658 | $225,332 | $46,612 | $178,720 |
| 2015 | $2,613 | $221,948 | $45,912 | $176,036 |
| 2014 | $2,559 | $217,601 | $45,013 | $172,588 |
Source: Public Records
Map
Nearby Homes
- 6604 Indian River Dr
- 6181 Oak Lakes Ln
- 6104 Meiggs Ct
- 6116 Mame Ct Unit 905
- 6105 Meiggs Ct Unit 1015
- 6515 Mi Ct
- 6245 Freedom Ln
- 6616 Silver Springs Ct
- 6834 Caywood Ct
- 6143 Blucher Ln
- 6230 Manitoba Ave
- 6228 Freedom Ln Unit 33
- 6048 Declaration Cir Unit 144
- 6717 Alden Ln
- 5756 Clearwater Dr
- 6709 Alden Ln
- 6047 Declaration Cir Unit 132
- 6359 Slippery Creek Ln
- 6217 Plymouth Rock Ln
- 5728 Lorella Way
- 5908 Fire Stick Ct
- 5901 Fire Stick Ct
- 5901 Papoose Ct
- 5905 Papoose Ct
- 5905 Fire Stick Ct
- 5909 Fire Stick Ct
- 5909 Papoose Ct
- 6613 Indian River Dr
- 6607 Indian River Dr
- 5913 Fire Stick Ct
- 5906 Fire Water Ct
- 5900 Papoose Ct
- 6601 Indian River Dr
- 5900 Fire Water Ct
- 5914 Fire Water Ct
- 5904 Papoose Ct
- 5922 Fire Water Ct
- 5908 Papoose Ct
- 5921 Running Water Ct
- 6600 Flaming Arrow Dr