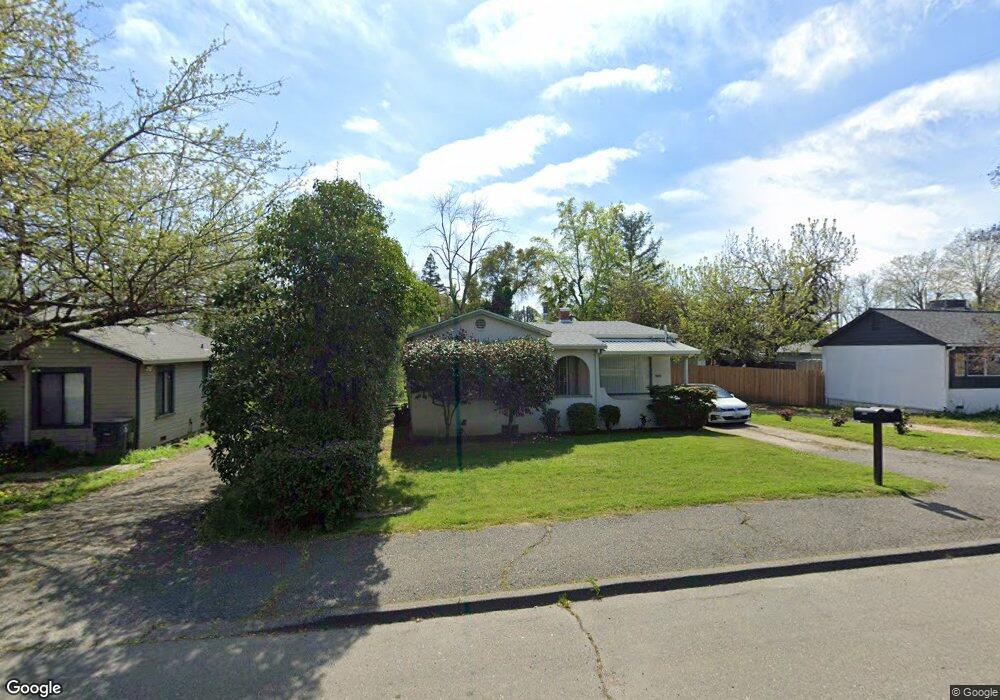
5900 Horseshoe Bar Rd Loomis, CA 95650
Estimated Value: $516,000 - $1,556,000
2
Beds
1
Bath
1,098
Sq Ft
$756/Sq Ft
Est. Value
About This Home
This home is located at 5900 Horseshoe Bar Rd, Loomis, CA 95650 and is currently estimated at $829,681, approximately $755 per square foot. 5900 Horseshoe Bar Rd is a home located in Placer County with nearby schools including Del Oro High School, Loomis Basin Charter School, and Sierra Foothills Academy.
Ownership History
Date
Name
Owned For
Owner Type
Purchase Details
Closed on
Aug 22, 2024
Sold by
Wedum Devon
Bought by
Ching Winsome A
Current Estimated Value
Purchase Details
Closed on
Aug 23, 2006
Sold by
Wedum Maritza E
Bought by
Wedum Devon
Home Financials for this Owner
Home Financials are based on the most recent Mortgage that was taken out on this home.
Original Mortgage
$350,000
Interest Rate
6.67%
Mortgage Type
Unknown
Purchase Details
Closed on
Aug 22, 2006
Sold by
Nyikes William John and Nyikes Arlene Masuko
Bought by
Ching Kenneth L and Ching Winsome A
Home Financials for this Owner
Home Financials are based on the most recent Mortgage that was taken out on this home.
Original Mortgage
$350,000
Interest Rate
6.67%
Mortgage Type
Unknown
Purchase Details
Closed on
Sep 11, 2003
Sold by
Masuda Masuo and Masuda Yaeko
Bought by
Masuda Masuo and Masuda Yaeko M
Create a Home Valuation Report for This Property
The Home Valuation Report is an in-depth analysis detailing your home's value as well as a comparison with similar homes in the area
Home Values in the Area
Average Home Value in this Area
Purchase History
| Date | Buyer | Sale Price | Title Company |
|---|---|---|---|
| Ching Winsome A | $135,000 | Placer Title | |
| Wedum Devon | -- | Multiple | |
| Ching Kenneth L | $350,000 | Multiple | |
| Masuda Masuo | -- | -- |
Source: Public Records
Mortgage History
| Date | Status | Borrower | Loan Amount |
|---|---|---|---|
| Previous Owner | Ching Kenneth L | $350,000 |
Source: Public Records
Tax History Compared to Growth
Tax History
| Year | Tax Paid | Tax Assessment Tax Assessment Total Assessment is a certain percentage of the fair market value that is determined by local assessors to be the total taxable value of land and additions on the property. | Land | Improvement |
|---|---|---|---|---|
| 2025 | $4,665 | $441,711 | $157,980 | $283,731 |
| 2023 | $4,665 | $354,120 | $193,158 | $160,962 |
| 2022 | $4,549 | $347,177 | $189,371 | $157,806 |
| 2021 | $4,424 | $340,370 | $185,658 | $154,712 |
| 2020 | $4,362 | $336,881 | $183,755 | $153,126 |
| 2019 | $4,283 | $330,276 | $180,152 | $150,124 |
| 2018 | $4,067 | $323,801 | $176,620 | $147,181 |
| 2017 | $3,991 | $317,453 | $173,157 | $144,296 |
| 2016 | $3,899 | $311,229 | $169,762 | $141,467 |
| 2015 | $3,814 | $306,556 | $167,213 | $139,343 |
| 2014 | $2,424 | $173,000 | $94,400 | $78,600 |
Source: Public Records
Map
Nearby Homes
- 5924 Walnut St
- 3879 Circle Dr
- 6470 Arcadia Ave
- 3844 Circle Dr
- 3592 Colony Ln
- 5685 Tudor Way
- 9775 King Rd
- 3955 Stonegate Ct
- 3440 Francis Dr
- 5480 Granite Dell Ct
- 4042 Quarry Ct
- 6085 Arcadia Ave
- 3293 Stone Field Way
- 3331 Taylor Rd
- 3301 Stone Field Way
- 5769 Connie Ct
- 3990 Noah Ln
- 3420 Grove Cir
- 4033 Hunter Oaks Ln
- 4028 Hunter Oaks Ln
- 5906 Horseshoe Bar Rd
- 5880 Horseshoe Bar Rd
- 5934 Horseshoe Bar Rd
- 3661 Magnolia St
- 3665 Magnolia St
- 5976 Horseshoe Bar Rd
- 5903 Walnut St
- 3671 Magnolia St
- 3690 Callison St
- 5895 Horseshoe Bar Rd
- 1 S Walnut St
- 5861 Horseshoe Bar Rd
- 5885 Horseshoe Bar Rd
- 5915 Walnut St
- 5901 Walnut St
- 5955 Horseshoe Bar Rd
- 5935 Walnut St
- 3668 Magnolia St
- 3850 Laird St
- 5845 Horseshoe Bar Rd