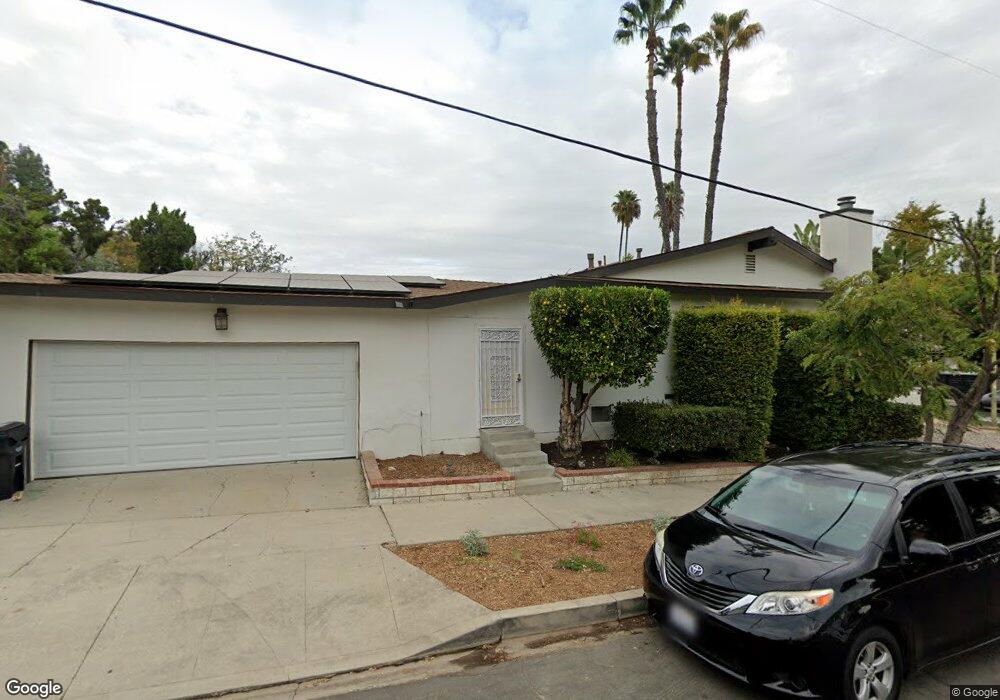
5901 Adler Ave Woodland Hills, CA 91367
Estimated Value: $1,287,373 - $1,416,000
4
Beds
3
Baths
2,278
Sq Ft
$600/Sq Ft
Est. Value
About This Home
This home is located at 5901 Adler Ave, Woodland Hills, CA 91367 and is currently estimated at $1,367,093, approximately $600 per square foot. 5901 Adler Ave is a home located in Los Angeles County with nearby schools including Lockhurst Drive Charter Elementary, Woodlake Elementary Community Charter, and Haynes Charter For Enriched Studies.
Ownership History
Date
Name
Owned For
Owner Type
Purchase Details
Closed on
Oct 23, 2024
Sold by
Kaufman Neal and Kaufman Jackeline
Bought by
Kaufman Family Trust and Kaufman
Current Estimated Value
Purchase Details
Closed on
Aug 24, 2020
Sold by
Kaufman Neal
Bought by
Kaufman Neal and Kaufman Jackeline Bento
Home Financials for this Owner
Home Financials are based on the most recent Mortgage that was taken out on this home.
Original Mortgage
$154,000
Interest Rate
3%
Mortgage Type
New Conventional
Purchase Details
Closed on
Jun 19, 2018
Sold by
Kaufman Jackeline
Bought by
Kaufman Neal
Home Financials for this Owner
Home Financials are based on the most recent Mortgage that was taken out on this home.
Original Mortgage
$157,000
Interest Rate
4.5%
Mortgage Type
Credit Line Revolving
Create a Home Valuation Report for This Property
The Home Valuation Report is an in-depth analysis detailing your home's value as well as a comparison with similar homes in the area
Home Values in the Area
Average Home Value in this Area
Purchase History
| Date | Buyer | Sale Price | Title Company |
|---|---|---|---|
| Kaufman Family Trust | -- | None Listed On Document | |
| Kaufman Neal | -- | First American Title Company | |
| Kaufman Neal | -- | Wfg National Title Company |
Source: Public Records
Mortgage History
| Date | Status | Borrower | Loan Amount |
|---|---|---|---|
| Previous Owner | Kaufman Neal | $154,000 | |
| Previous Owner | Kaufman Neal | $157,000 |
Source: Public Records
Tax History Compared to Growth
Tax History
| Year | Tax Paid | Tax Assessment Tax Assessment Total Assessment is a certain percentage of the fair market value that is determined by local assessors to be the total taxable value of land and additions on the property. | Land | Improvement |
|---|---|---|---|---|
| 2025 | $4,620 | $362,600 | $115,999 | $246,601 |
| 2024 | $4,620 | $355,491 | $113,725 | $241,766 |
| 2023 | $3,700 | $278,754 | $111,496 | $167,258 |
| 2022 | $3,538 | $273,289 | $109,310 | $163,979 |
| 2021 | $3,483 | $267,931 | $107,167 | $160,764 |
| 2019 | $3,383 | $259,987 | $103,990 | $155,997 |
| 2018 | $3,265 | $254,890 | $101,951 | $152,939 |
| 2016 | $3,098 | $244,994 | $97,993 | $147,001 |
| 2015 | $3,055 | $241,315 | $96,522 | $144,793 |
| 2014 | $3,072 | $236,589 | $94,632 | $141,957 |
Source: Public Records
Map
Nearby Homes
- 5929 Adler Ave
- 23952 Nomar St
- 23853 Hatteras St
- 6022 Elba Place
- 5831 Elba Place
- 23812 Calvert St
- 5931 Neddy Ave
- 23717 Crosson Dr
- 6020 Neddy Ave
- 5700 El Canon Ave
- 6153 Debs Ave
- 6009 Neddy Ave
- 6001 Manton Ave
- 24017 Sylvan St
- 5630 Blanco Ave
- 24221 Aetna St
- 5622 Le Sage Ave
- 6236 Kenwater Ave
- 5534 Pattilar Ave
- 24244 Friar St
- 5915 Adler Ave
- 23921 Crosson Dr
- 23908 Califa St
- 23861 Califa St
- 23900 Califa St
- 23923 Crosson Dr
- 5921 Adler Ave
- 23916 Califa St
- 5912 Adler Ave
- 23855 Califa St
- 5918 Adler Ave
- 23861 Crosson Dr
- 5924 Adler Ave
- 23849 Califa St
- 5933 Adler Ave
- 23929 Califa St
- 23857 Crosson Dr
- 23930 Califa St
- 5930 Adler Ave
- 23848 Tiara St