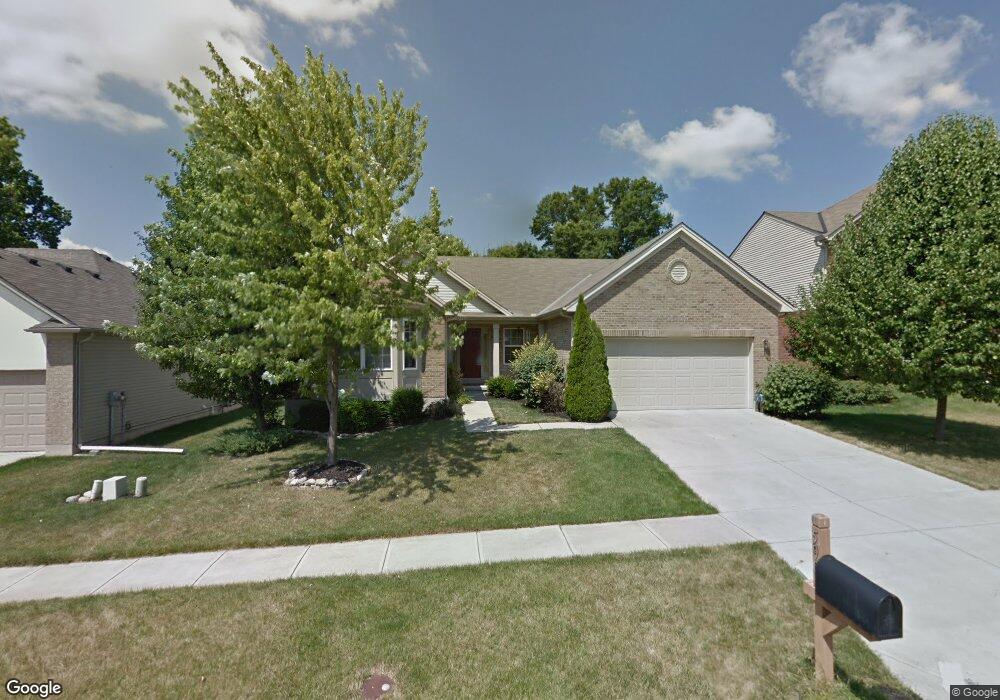
5901 Turning Leaf Way Maineville, OH 45039
Estimated Value: $397,542 - $432,000
2
Beds
2
Baths
2,151
Sq Ft
$194/Sq Ft
Est. Value
About This Home
This home is located at 5901 Turning Leaf Way, Maineville, OH 45039 and is currently estimated at $416,386, approximately $193 per square foot. 5901 Turning Leaf Way is a home located in Warren County with nearby schools including Little Miami Early Childhood Center, Little Miami Intermediate Middle School, and Little Miami Middle School.
Ownership History
Date
Name
Owned For
Owner Type
Purchase Details
Closed on
Oct 29, 2004
Sold by
John Henry Homes Inc
Bought by
Clark Carol Denise
Current Estimated Value
Home Financials for this Owner
Home Financials are based on the most recent Mortgage that was taken out on this home.
Original Mortgage
$197,686
Outstanding Balance
$82,636
Interest Rate
3.87%
Mortgage Type
Purchase Money Mortgage
Estimated Equity
$333,750
Purchase Details
Closed on
Aug 12, 2004
Sold by
Sjl Land Group Llc
Bought by
John Henry Homes Inc
Home Financials for this Owner
Home Financials are based on the most recent Mortgage that was taken out on this home.
Original Mortgage
$54,000,000
Interest Rate
6.08%
Mortgage Type
Purchase Money Mortgage
Purchase Details
Closed on
Mar 16, 2004
Sold by
Turning Leaf Llc
Bought by
Sjl Land Group Llc
Create a Home Valuation Report for This Property
The Home Valuation Report is an in-depth analysis detailing your home's value as well as a comparison with similar homes in the area
Home Values in the Area
Average Home Value in this Area
Purchase History
| Date | Buyer | Sale Price | Title Company |
|---|---|---|---|
| Clark Carol Denise | $247,133 | Rtc Title Llc | |
| John Henry Homes Inc | $44,633 | -- | |
| Sjl Land Group Llc | $208,166 | -- |
Source: Public Records
Mortgage History
| Date | Status | Borrower | Loan Amount |
|---|---|---|---|
| Open | Clark Carol Denise | $197,686 | |
| Previous Owner | John Henry Homes Inc | $54,000,000 | |
| Closed | Clark Carol Denise | $49,422 |
Source: Public Records
Tax History
| Year | Tax Paid | Tax Assessment Tax Assessment Total Assessment is a certain percentage of the fair market value that is determined by local assessors to be the total taxable value of land and additions on the property. | Land | Improvement |
|---|---|---|---|---|
| 2025 | $5,624 | $126,130 | $28,000 | $98,130 |
| 2024 | $5,624 | $126,130 | $28,000 | $98,130 |
| 2023 | $4,876 | $97,573 | $14,042 | $83,531 |
| 2022 | $4,819 | $97,573 | $14,042 | $83,531 |
| 2021 | $4,595 | $97,573 | $14,042 | $83,531 |
| 2020 | $4,563 | $82,688 | $11,900 | $70,788 |
| 2019 | $4,639 | $82,688 | $11,900 | $70,788 |
| 2018 | $4,505 | $82,688 | $11,900 | $70,788 |
| 2017 | $4,008 | $73,234 | $10,721 | $62,514 |
| 2016 | $4,103 | $73,234 | $10,721 | $62,514 |
| 2015 | $4,100 | $73,234 | $10,721 | $62,514 |
| 2014 | $4,257 | $67,190 | $9,840 | $57,350 |
| 2013 | $4,148 | $81,290 | $11,900 | $69,390 |
Source: Public Records
Map
Nearby Homes
- 616 Crabapple Ct
- 5900 Driftwood Ct
- 5705 Pepperridge Ct
- 161 Arbor Glen Ct
- 668 Thornton Dr
- 5598 Noble Ct
- 5259 Little Turtle Dr
- 723 Grande Oaks Dr
- 5530 Windsor Ct
- 122 Deere Run Ln
- 120 Ridgeview Ln
- 0 Deere Run Ln Unit 1836428
- 98 Bedles Ct
- 767 Elm Tree Dr
- 5234 Highmeadow Place
- 219 Chateau Valley Ln
- 5223 Grants Settlement
- 5079 Ross Ridge Rd
- 329 Stone Ridge Blvd
- 1065 Dunstan Ct
- 5897 Turning Leaf Way
- 5917 Turning Leaf Way
- 5893 Turning Leaf Way
- 5931 Turning Leaf Way
- 488 Honey Locust Ct
- 5972 Pepperridge Ct
- 5889 Turning Leaf Way
- 5945 Turning Leaf Way
- 5958 Pepperridge Ct
- 5938 Pepperridge Ct
- 5984 Pepperridge Ct
- 500 Honey Locust Ct
- 499 Woodbine Ct
- 5902 Pepperridge Ct
- 86 Honey Locust Ct
- 5878 Pepperridge Ct
- 5885 Turning Leaf Way
- 5961 Turning Leaf Way
- 5961 Turning Leaf Way Unit 59
- 5864 Pepperridge Ct
Your Personal Tour Guide
Ask me questions while you tour the home.