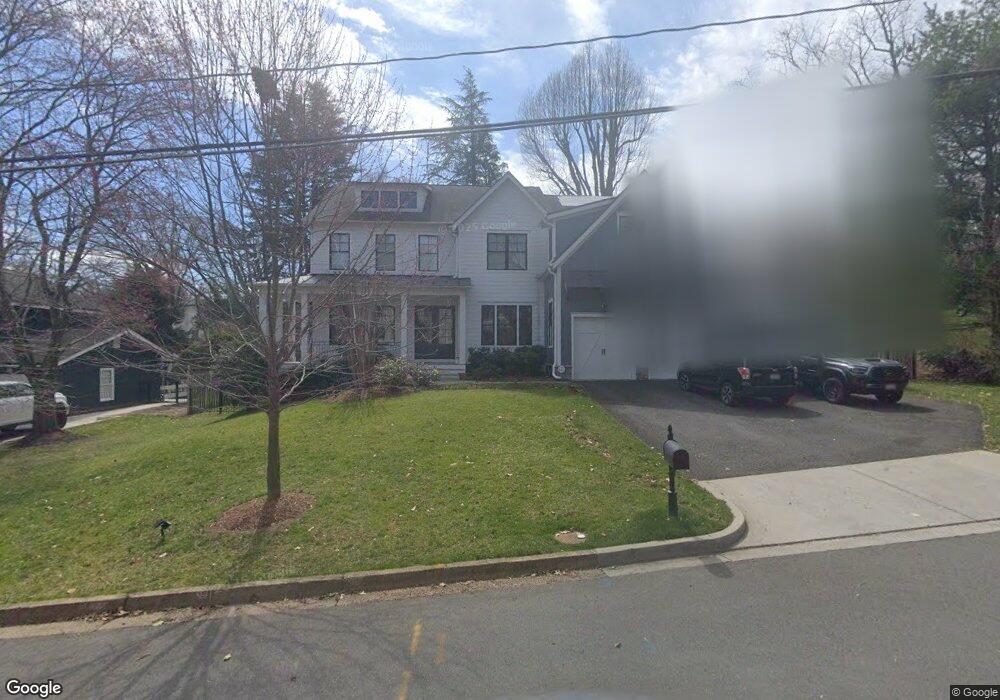
5901 Upton St Unit 3109 McLean, VA 22101
Estimated Value: $2,883,000 - $3,530,000
6
Beds
7
Baths
4,960
Sq Ft
$637/Sq Ft
Est. Value
About This Home
This home is located at 5901 Upton St Unit 3109, McLean, VA 22101 and is currently estimated at $3,159,147, approximately $636 per square foot. 5901 Upton St Unit 3109 is a home located in Fairfax County with nearby schools including Chesterbrook Elementary School, Longfellow Middle School, and McLean High School.
Ownership History
Date
Name
Owned For
Owner Type
Purchase Details
Closed on
May 5, 2023
Sold by
Lahr Troy and Lahr Janet
Bought by
Xu Yifang
Current Estimated Value
Home Financials for this Owner
Home Financials are based on the most recent Mortgage that was taken out on this home.
Original Mortgage
$1,680,000
Outstanding Balance
$1,617,543
Interest Rate
4.75%
Mortgage Type
New Conventional
Estimated Equity
$1,541,604
Purchase Details
Closed on
Sep 1, 2017
Sold by
Ashton Gary
Bought by
Lahr Troy and Lahr Janet
Home Financials for this Owner
Home Financials are based on the most recent Mortgage that was taken out on this home.
Original Mortgage
$12,000,000
Interest Rate
2.75%
Mortgage Type
Adjustable Rate Mortgage/ARM
Purchase Details
Closed on
Nov 17, 2015
Sold by
Fe M Gutierrez Trust Dated May 11 2006
Bought by
Ashton Gary J
Create a Home Valuation Report for This Property
The Home Valuation Report is an in-depth analysis detailing your home's value as well as a comparison with similar homes in the area
Home Values in the Area
Average Home Value in this Area
Purchase History
| Date | Buyer | Sale Price | Title Company |
|---|---|---|---|
| Xu Yifang | $2,800,000 | Strategic National Title | |
| Lahr Troy | $2,200,000 | None Available | |
| Ashton Gary J | $875,000 | Bridge Title Inc |
Source: Public Records
Mortgage History
| Date | Status | Borrower | Loan Amount |
|---|---|---|---|
| Open | Xu Yifang | $1,680,000 | |
| Previous Owner | Lahr Troy | $12,000,000 |
Source: Public Records
Tax History
| Year | Tax Paid | Tax Assessment Tax Assessment Total Assessment is a certain percentage of the fair market value that is determined by local assessors to be the total taxable value of land and additions on the property. | Land | Improvement |
|---|---|---|---|---|
| 2025 | $32,958 | $2,863,470 | $773,000 | $2,090,470 |
| 2024 | $32,958 | $2,742,550 | $773,000 | $1,969,550 |
| 2023 | $27,590 | $2,353,460 | $773,000 | $1,580,460 |
| 2022 | $23,720 | $1,992,740 | $638,000 | $1,354,740 |
| 2021 | $22,607 | $1,855,960 | $523,000 | $1,332,960 |
| 2020 | $22,753 | $1,855,190 | $523,000 | $1,332,190 |
| 2019 | $26,498 | $2,164,360 | $523,000 | $1,641,360 |
| 2018 | $24,110 | $2,096,550 | $503,000 | $1,593,550 |
| 2017 | $20,409 | $1,847,010 | $485,000 | $1,362,010 |
| 2016 | $11,105 | $910,730 | $485,000 | $425,730 |
Source: Public Records
Map
Nearby Homes
- 5908 Calla Dr
- 1610 Brookside Rd
- 1468 Highwood Dr
- 1501 Woodacre Dr
- 1515 Crestwood Ln
- 1441 Woodacre Dr
- 4054 41st St N
- 5921 Chesterbrook Rd
- 6020 Copely Ln
- 4006 N Glebe Rd
- 6013 Woodland Terrace
- 1317 Merrie Ridge Rd
- 4283 38th St N
- 3916 Military Rd
- 1347 Kirby Rd
- 6156 Tompkins Dr
- 702 Belgrove Rd
- 400 Chain Bridge Rd
- 6144 Chesterbrook Rd
- 6161 Mori St
Your Personal Tour Guide
Ask me questions while you tour the home.