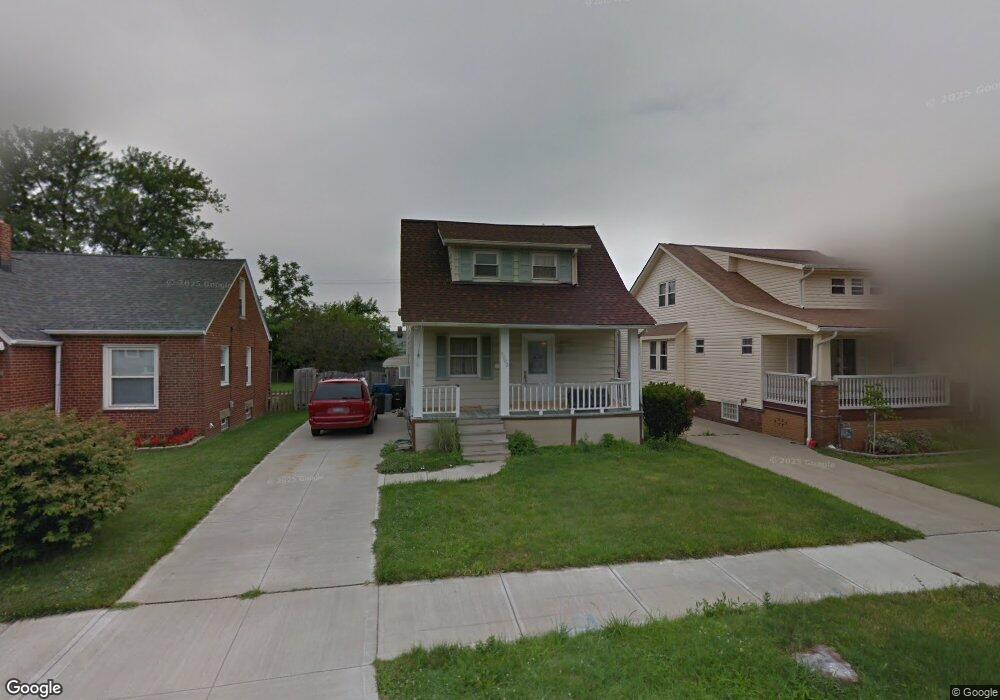
5902 Bradley Ave Cleveland, OH 44129
Estimated Value: $147,571 - $163,000
3
Beds
1
Bath
810
Sq Ft
$189/Sq Ft
Est. Value
About This Home
This home is located at 5902 Bradley Ave, Cleveland, OH 44129 and is currently estimated at $152,893, approximately $188 per square foot. 5902 Bradley Ave is a home located in Cuyahoga County with nearby schools including Thoreau Park Elementary School, Shiloh Middle School, and Parma High School.
Ownership History
Date
Name
Owned For
Owner Type
Purchase Details
Closed on
Nov 24, 1999
Sold by
Wagner Darlene R and Wagner Theodus Darlene
Bought by
Kovac Todd J
Current Estimated Value
Home Financials for this Owner
Home Financials are based on the most recent Mortgage that was taken out on this home.
Original Mortgage
$55,930
Outstanding Balance
$17,362
Interest Rate
7.97%
Mortgage Type
FHA
Estimated Equity
$135,531
Purchase Details
Closed on
Jun 16, 1997
Sold by
Vujevich Joel P
Bought by
Wagner Darlene R
Purchase Details
Closed on
Apr 24, 1987
Sold by
Tokar Brian J and Tokar Nancy A
Bought by
Vujevich Joel F
Purchase Details
Closed on
Mar 9, 1982
Sold by
Nova C Hamilton
Bought by
Tokar Brian J and Tokar Nancy A
Purchase Details
Closed on
Feb 26, 1981
Sold by
Hamilton Nova V
Bought by
Nova C Hamilton
Purchase Details
Closed on
Oct 23, 1979
Sold by
Brant Elsie L
Bought by
Hamilton Mickey C
Purchase Details
Closed on
Jan 1, 1975
Bought by
Brant Elsie L
Create a Home Valuation Report for This Property
The Home Valuation Report is an in-depth analysis detailing your home's value as well as a comparison with similar homes in the area
Home Values in the Area
Average Home Value in this Area
Purchase History
| Date | Buyer | Sale Price | Title Company |
|---|---|---|---|
| Kovac Todd J | $62,700 | Midland Title Security Inc | |
| Wagner Darlene R | $68,500 | -- | |
| Vujevich Joel F | $40,000 | -- | |
| Tokar Brian J | $28,900 | -- | |
| Nova C Hamilton | -- | -- | |
| Hamilton Nova | -- | -- | |
| Hamilton Mickey C | -- | -- | |
| Brant Elsie L | -- | -- |
Source: Public Records
Mortgage History
| Date | Status | Borrower | Loan Amount |
|---|---|---|---|
| Open | Kovac Todd J | $55,930 | |
| Closed | Wagner Darlene R | -- |
Source: Public Records
Tax History Compared to Growth
Tax History
| Year | Tax Paid | Tax Assessment Tax Assessment Total Assessment is a certain percentage of the fair market value that is determined by local assessors to be the total taxable value of land and additions on the property. | Land | Improvement |
|---|---|---|---|---|
| 2024 | $2,624 | $41,615 | $10,325 | $31,290 |
| 2023 | $2,418 | $33,080 | $8,510 | $24,570 |
| 2022 | $2,394 | $33,080 | $8,510 | $24,570 |
| 2021 | $2,459 | $33,080 | $8,510 | $24,570 |
| 2020 | $2,161 | $25,450 | $6,550 | $18,900 |
| 2019 | $2,061 | $72,700 | $18,700 | $54,000 |
| 2018 | $1,913 | $25,450 | $6,550 | $18,900 |
| 2017 | $1,912 | $21,740 | $5,460 | $16,280 |
| 2016 | $1,901 | $21,740 | $5,460 | $16,280 |
| 2015 | $1,783 | $21,740 | $5,460 | $16,280 |
| 2014 | $1,783 | $22,200 | $5,570 | $16,630 |
Source: Public Records
Map
Nearby Homes
- 5810 Laverne Ave
- 5618 Bradley Ave
- 6014 Laverne Ave
- 6011 Theota Ave
- 6211 Luelda Ave
- 5906 Velma Ave
- 5511 Velma Ave
- 6606 Theota Ave
- 5815 Westlake Ave
- 5406 Merkle Ave
- 4915 Tuxedo Ave
- 4910 Russell Ave
- 4911 Tuxedo Ave
- 5000 Torrington Ave
- 5914 Forest Ave
- 5212 Wood Ave
- 6215 Forest Ave
- 5521 W 48th St
- 6306 Gilbert Ave
- 6711 Forest Ave
- 5814 Bradley Ave
- 5906 Bradley Ave
- 5810 Bradley Ave
- 5910 Bradley Ave
- 5806 Bradley Ave
- 5903 Laverne Ave
- 5907 Laverne Ave
- 5815 Laverne Ave
- 5911 Laverne Ave
- 5802 Bradley Ave
- 6002 Bradley Ave
- 5807 Laverne Ave
- 5903 Bradley Ave
- 5815 Bradley Ave
- 5907 Bradley Ave
- 5714 Bradley Ave
- 6006 Bradley Ave
- 5811 Bradley Ave
- 5911 Bradley Ave
- 5803 Laverne Ave