5902 Fern St El Cerrito, CA 94530
Estimated Value: $1,028,941 - $1,170,000
4
Beds
2
Baths
1,867
Sq Ft
$593/Sq Ft
Est. Value
About This Home
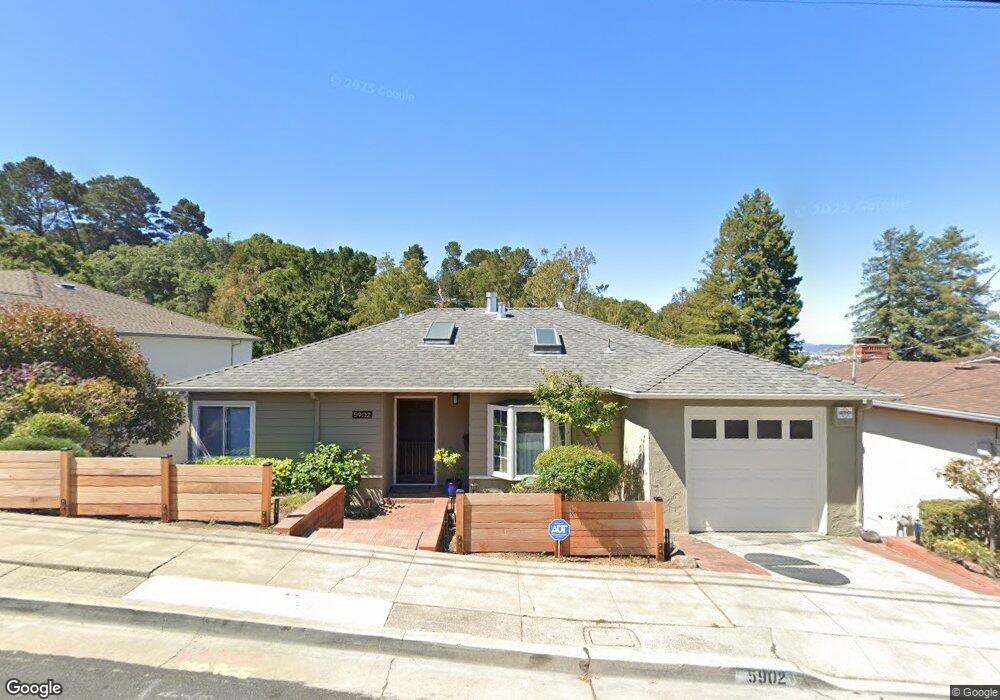
This home is located at 5902 Fern St, El Cerrito, CA 94530 and is currently estimated at $1,106,985, approximately $592 per square foot. 5902 Fern St is a home located in Contra Costa County with nearby schools including Madera Elementary School, Fred T. Korematsu Middle School, and El Cerrito Senior High School.
Ownership History
Date
Name
Owned For
Owner Type
Purchase Details
Closed on
Nov 21, 1997
Sold by
Ko Donna L
Bought by
Ko Donna L
Current Estimated Value
Home Financials for this Owner
Home Financials are based on the most recent Mortgage that was taken out on this home.
Original Mortgage
$100,000
Outstanding Balance
$16,484
Interest Rate
7.33%
Mortgage Type
Purchase Money Mortgage
Estimated Equity
$1,090,501
Purchase Details
Closed on
Mar 17, 1994
Sold by
Lin Danny J and Ko Donna L
Bought by
Ko Donna L
Home Financials for this Owner
Home Financials are based on the most recent Mortgage that was taken out on this home.
Original Mortgage
$100,000
Interest Rate
7.21%
Mortgage Type
Purchase Money Mortgage
Create a Home Valuation Report for This Property
The Home Valuation Report is an in-depth analysis detailing your home's value as well as a comparison with similar homes in the area
Home Values in the Area
Average Home Value in this Area
Purchase History
| Date | Buyer | Sale Price | Title Company |
|---|---|---|---|
| Ko Donna L | -- | Old Republic Title Company | |
| Ko Donna L | -- | North American Title Co Inc |
Source: Public Records
Mortgage History
| Date | Status | Borrower | Loan Amount |
|---|---|---|---|
| Open | Ko Donna L | $100,000 | |
| Closed | Ko Donna L | $100,000 |
Source: Public Records
Tax History Compared to Growth
Tax History
| Year | Tax Paid | Tax Assessment Tax Assessment Total Assessment is a certain percentage of the fair market value that is determined by local assessors to be the total taxable value of land and additions on the property. | Land | Improvement |
|---|---|---|---|---|
| 2025 | $5,443 | $346,416 | $155,022 | $191,394 |
| 2024 | $5,350 | $339,625 | $151,983 | $187,642 |
| 2023 | $5,350 | $332,966 | $149,003 | $183,963 |
| 2022 | $5,249 | $326,438 | $146,082 | $180,356 |
| 2021 | $5,204 | $320,038 | $143,218 | $176,820 |
| 2019 | $4,874 | $310,547 | $138,971 | $171,576 |
| 2018 | $4,703 | $304,459 | $136,247 | $168,212 |
| 2017 | $4,633 | $298,490 | $133,576 | $164,914 |
| 2016 | $4,611 | $292,638 | $130,957 | $161,681 |
| 2015 | $4,624 | $288,243 | $128,990 | $159,253 |
| 2014 | $4,583 | $282,598 | $126,464 | $156,134 |
Source: Public Records
Map
Nearby Homes