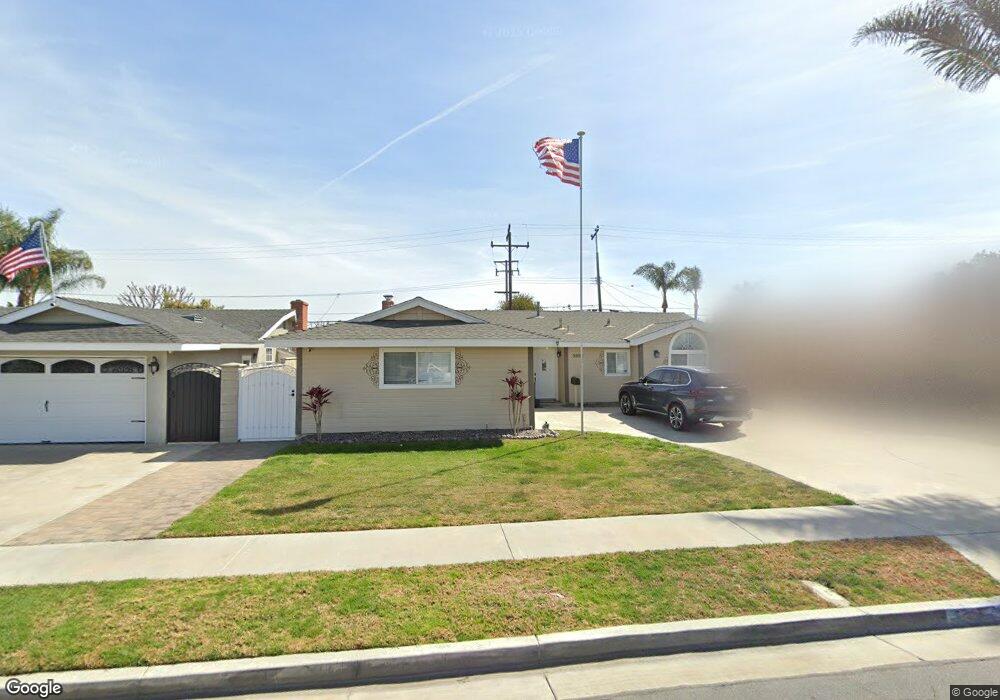
5902 Par Cir Huntington Beach, CA 92649
Estimated Value: $1,214,000 - $1,323,000
5
Beds
2
Baths
1,848
Sq Ft
$685/Sq Ft
Est. Value
About This Home
This home is located at 5902 Par Cir, Huntington Beach, CA 92649 and is currently estimated at $1,266,795, approximately $685 per square foot. 5902 Par Cir is a home located in Orange County with nearby schools including Village View Elementary School, Spring View Middle School, and Marina High School.
Ownership History
Date
Name
Owned For
Owner Type
Purchase Details
Closed on
May 31, 2002
Sold by
Brayton Robert L and Brayton Francesca M
Bought by
Brayton Matthew and Brayton Shannon
Current Estimated Value
Home Financials for this Owner
Home Financials are based on the most recent Mortgage that was taken out on this home.
Original Mortgage
$207,000
Outstanding Balance
$85,727
Interest Rate
6.52%
Estimated Equity
$1,181,068
Purchase Details
Closed on
Apr 11, 2002
Sold by
Larsen David S and Larsen Lisa L
Bought by
Brayton Robert L and Brayton Francesca M
Home Financials for this Owner
Home Financials are based on the most recent Mortgage that was taken out on this home.
Original Mortgage
$207,000
Outstanding Balance
$85,727
Interest Rate
6.52%
Estimated Equity
$1,181,068
Purchase Details
Closed on
Dec 2, 1997
Sold by
Israel Charles E and Israel Lisa A
Bought by
Larsen David S and Larsen Lisa L
Home Financials for this Owner
Home Financials are based on the most recent Mortgage that was taken out on this home.
Original Mortgage
$223,400
Interest Rate
7.05%
Create a Home Valuation Report for This Property
The Home Valuation Report is an in-depth analysis detailing your home's value as well as a comparison with similar homes in the area
Home Values in the Area
Average Home Value in this Area
Purchase History
| Date | Buyer | Sale Price | Title Company |
|---|---|---|---|
| Brayton Matthew | $415,000 | Chicago Title Co | |
| Brayton Robert L | $426,000 | Chicago Title Co | |
| Larsen David S | $248,500 | Lawyers Title Company |
Source: Public Records
Mortgage History
| Date | Status | Borrower | Loan Amount |
|---|---|---|---|
| Open | Brayton Matthew | $207,000 | |
| Previous Owner | Larsen David S | $223,400 |
Source: Public Records
Tax History Compared to Growth
Tax History
| Year | Tax Paid | Tax Assessment Tax Assessment Total Assessment is a certain percentage of the fair market value that is determined by local assessors to be the total taxable value of land and additions on the property. | Land | Improvement |
|---|---|---|---|---|
| 2025 | $6,810 | $604,914 | $488,925 | $115,989 |
| 2024 | $6,810 | $593,053 | $479,338 | $113,715 |
| 2023 | $6,654 | $581,425 | $469,939 | $111,486 |
| 2022 | $6,555 | $570,025 | $460,725 | $109,300 |
| 2021 | $6,434 | $558,849 | $451,692 | $107,157 |
| 2020 | $6,362 | $553,119 | $447,060 | $106,059 |
| 2019 | $6,251 | $542,274 | $438,294 | $103,980 |
| 2018 | $6,109 | $531,642 | $429,700 | $101,942 |
| 2017 | $6,011 | $521,218 | $421,274 | $99,944 |
| 2016 | $5,764 | $510,999 | $413,014 | $97,985 |
| 2015 | $5,676 | $503,324 | $406,810 | $96,514 |
| 2014 | $5,563 | $493,465 | $398,841 | $94,624 |
Source: Public Records
Map
Nearby Homes
- 16261 Angler Ln
- 16542 Los Verdes Ln
- 5751 Mangrum Dr
- 5591 Heil Ave
- 16652 Busby Ln
- 6292 Heil Ave
- 6351 Gloria Dr
- 15801 Carrie Ln
- 6301 Warner Ave Unit 88
- 6301 Warner Ave Unit 40
- 6522 Limerick Dr
- 17071 Pinehurst Ln
- 6051 Summerdale Dr
- 6631 Walton Dr
- 17042 Twain Ln
- 16081 Windemeir Ln
- 5200 Heil Ave Unit 18
- 5200 Heil Ave Unit 8
- 6032 Vane Cir
- 5192 Skylark Dr
- 5912 Par Cir
- 5892 Par Cir
- 16352 Fairway Ln
- 5922 Par Cir
- 16362 Fairway Ln
- 5901 Par Cir
- 5891 Par Cir
- 5911 Par Cir
- 5942 Par Cir
- 5921 Par Cir
- 16341 Fairway Ln
- 16331 Fairway Ln
- 16372 Fairway Ln
- 16351 Fairway Ln
- 16321 Fairway Ln
- 5941 Par Cir
- 16361 Fairway Ln
- 5902 Meadowlark Dr
- 5892 Meadowlark Dr
- 5952 Par Cir