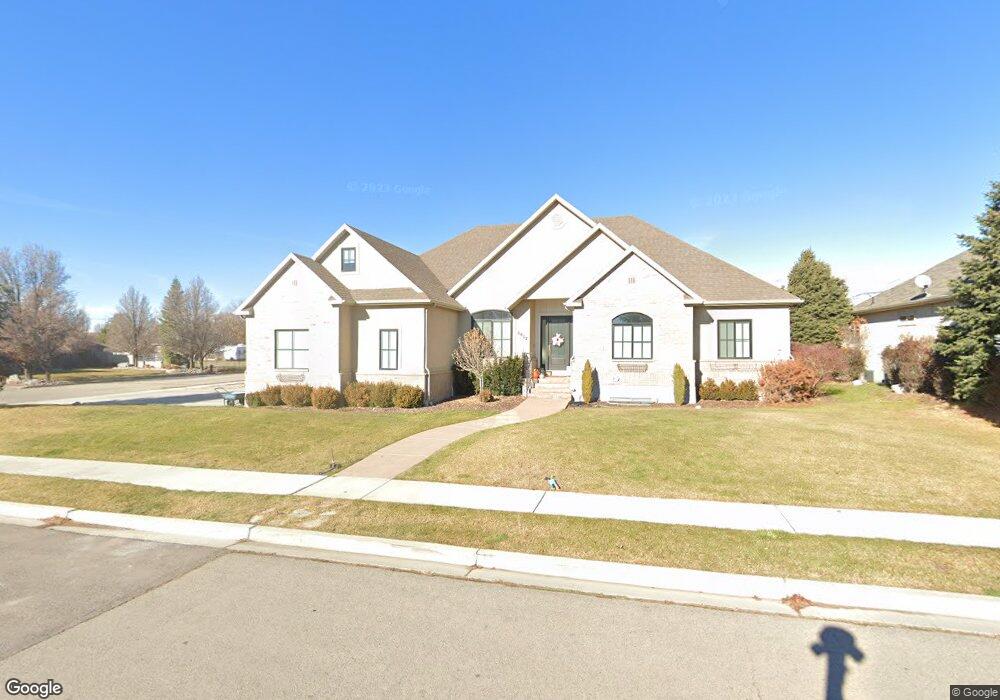
5902 W Canterbury Park Cir Highland, UT 84003
Estimated Value: $858,000 - $1,194,000
6
Beds
4
Baths
4,691
Sq Ft
$218/Sq Ft
Est. Value
About This Home
This home is located at 5902 W Canterbury Park Cir, Highland, UT 84003 and is currently estimated at $1,021,259, approximately $217 per square foot. 5902 W Canterbury Park Cir is a home located in Utah County with nearby schools including Legacy Elementary School, Mountain Ridge Junior High School, and American Fork High School.
Ownership History
Date
Name
Owned For
Owner Type
Purchase Details
Closed on
Mar 2, 2016
Sold by
Pb And M Investments Llc
Bought by
Smith Jordan and Smith Kelly
Current Estimated Value
Home Financials for this Owner
Home Financials are based on the most recent Mortgage that was taken out on this home.
Original Mortgage
$414,000
Outstanding Balance
$329,411
Interest Rate
3.81%
Mortgage Type
New Conventional
Estimated Equity
$691,848
Purchase Details
Closed on
Feb 13, 2015
Sold by
Bradshaw Stephen R
Bought by
Pb &M Investments Llc
Purchase Details
Closed on
Apr 27, 2007
Sold by
Bradshaw Stephen R
Bought by
Bradshaw C Roshaun
Purchase Details
Closed on
Jun 15, 2005
Sold by
Nelson Michael S
Bought by
Bradshaw Stephen R
Purchase Details
Closed on
Mar 8, 2002
Sold by
Interwest Industries Inc
Bought by
Nelson Michael S
Create a Home Valuation Report for This Property
The Home Valuation Report is an in-depth analysis detailing your home's value as well as a comparison with similar homes in the area
Home Values in the Area
Average Home Value in this Area
Purchase History
| Date | Buyer | Sale Price | Title Company |
|---|---|---|---|
| Smith Jordan | -- | Title West | |
| Pb &M Investments Llc | $386,000 | None Available | |
| Bradshaw C Roshaun | -- | None Available | |
| Bradshaw Stephen R | -- | Timp Title Insurance Agency | |
| Nelson Michael S | -- | Inwest Title Services Inc | |
| Interwest Industries Inc | -- | Inwest Title Services Inc |
Source: Public Records
Mortgage History
| Date | Status | Borrower | Loan Amount |
|---|---|---|---|
| Open | Smith Jordan | $414,000 |
Source: Public Records
Tax History Compared to Growth
Tax History
| Year | Tax Paid | Tax Assessment Tax Assessment Total Assessment is a certain percentage of the fair market value that is determined by local assessors to be the total taxable value of land and additions on the property. | Land | Improvement |
|---|---|---|---|---|
| 2025 | $3,950 | $508,530 | $370,400 | $554,200 |
| 2024 | $3,950 | $487,850 | $0 | $0 |
| 2023 | $3,746 | $499,125 | $0 | $0 |
| 2022 | $3,482 | $449,900 | $0 | $0 |
| 2021 | $3,097 | $596,000 | $197,700 | $398,300 |
| 2020 | $2,960 | $558,600 | $171,900 | $386,700 |
| 2019 | $2,792 | $551,200 | $171,900 | $379,300 |
| 2018 | $2,720 | $510,400 | $158,200 | $352,200 |
| 2017 | $2,482 | $248,545 | $0 | $0 |
| 2016 | $2,711 | $253,715 | $0 | $0 |
| 2015 | $2,710 | $240,405 | $0 | $0 |
| 2014 | $2,700 | $237,380 | $0 | $0 |
Source: Public Records
Map
Nearby Homes
- 9780 N 6000 W
- 5973 W 9960 N
- 703 S 850 W
- 9947 N Yorkshire Ct
- 35 W 1350 N
- 6190 W 10050 N
- 10197 N 5750 W
- 179 W 1290 N
- 287 W 1360 N
- 1438 N 400 W
- 11337 N 5950 W Unit 7
- 356 W 1300 N
- 5586 W 10130 N
- 5423 W Pebble Ln
- 1201 N 160 E
- 6399 W 10150 N
- 1071 Timpview Dr
- 5378 W 10130 N
- 344 W 1080 N
- 9924 N 6630 W Unit 9
- 5905 W Canterbury Park Cir
- 5905 W Canterbury Park Cir Unit 27
- 5902 W Canterbury Unit 17
- 5902 W Canterbury
- 5884 W Canterbury Park Cir Unit 16
- 5884 W Canterbury Park Cir
- 5891 W Canterbury Park Cir
- 5891 W Canterbury Park Cir Unit 28
- 5891 W Canterbury Park Cir
- 5875 W Canterbury Park Cir Unit 29
- 5864 W Canterbury Park Cir
- 9813 N 5920 W
- 5875 W Canterbury Park Cir
- 9785 N 5920 W
- 9785 N 5920 W Unit 19
- 5861 W Canterbury Park Cir
- 5861 W Canterbury Park Cir
- 5902 W 9800 N
- 5845 W Canterbury Park Cir
- 9759 N 5920 W