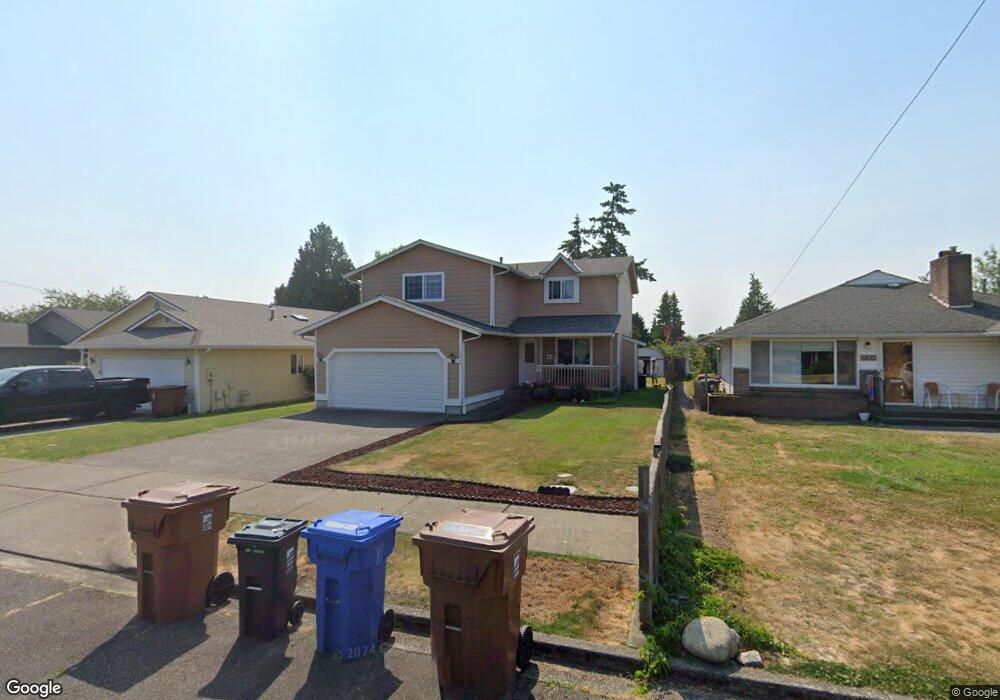
5902E McGhee St Tacoma, WA 98404
Eastside NeighborhoodEstimated Value: $494,000 - $542,000
4
Beds
3
Baths
1,780
Sq Ft
$291/Sq Ft
Est. Value
About This Home
This home is located at 5902E McGhee St, Tacoma, WA 98404 and is currently estimated at $517,687, approximately $290 per square foot. 5902E McGhee St is a home located in Pierce County with nearby schools including Oakland High School, Hunt Middle School, and Mount Tahoma High School.
Ownership History
Date
Name
Owned For
Owner Type
Purchase Details
Closed on
Apr 27, 2000
Sold by
Remy International Inc
Bought by
Vanho Tuan and Nguyen Lien T
Current Estimated Value
Home Financials for this Owner
Home Financials are based on the most recent Mortgage that was taken out on this home.
Original Mortgage
$116,400
Interest Rate
8.24%
Purchase Details
Closed on
Dec 3, 1999
Sold by
Rolf Orville M
Bought by
Remy International Inc
Create a Home Valuation Report for This Property
The Home Valuation Report is an in-depth analysis detailing your home's value as well as a comparison with similar homes in the area
Home Values in the Area
Average Home Value in this Area
Purchase History
| Date | Buyer | Sale Price | Title Company |
|---|---|---|---|
| Vanho Tuan | $145,500 | -- | |
| Remy International Inc | $27,000 | -- |
Source: Public Records
Mortgage History
| Date | Status | Borrower | Loan Amount |
|---|---|---|---|
| Closed | Vanho Tuan | $116,400 |
Source: Public Records
Tax History Compared to Growth
Tax History
| Year | Tax Paid | Tax Assessment Tax Assessment Total Assessment is a certain percentage of the fair market value that is determined by local assessors to be the total taxable value of land and additions on the property. | Land | Improvement |
|---|---|---|---|---|
| 2025 | $4,753 | $490,800 | $187,700 | $303,100 |
| 2024 | $4,753 | $457,800 | $180,800 | $277,000 |
| 2023 | $4,753 | $426,900 | $172,200 | $254,700 |
| 2022 | $4,533 | $465,100 | $160,800 | $304,300 |
| 2021 | $4,171 | $331,800 | $102,400 | $229,400 |
| 2019 | $3,628 | $301,800 | $84,700 | $217,100 |
| 2018 | $3,858 | $279,100 | $68,600 | $210,500 |
| 2017 | $3,434 | $244,200 | $54,800 | $189,400 |
| 2016 | $2,984 | $185,000 | $41,000 | $144,000 |
| 2014 | $2,570 | $171,600 | $38,700 | $132,900 |
| 2013 | $2,570 | $149,700 | $34,000 | $115,700 |
Source: Public Records
Map
Nearby Homes