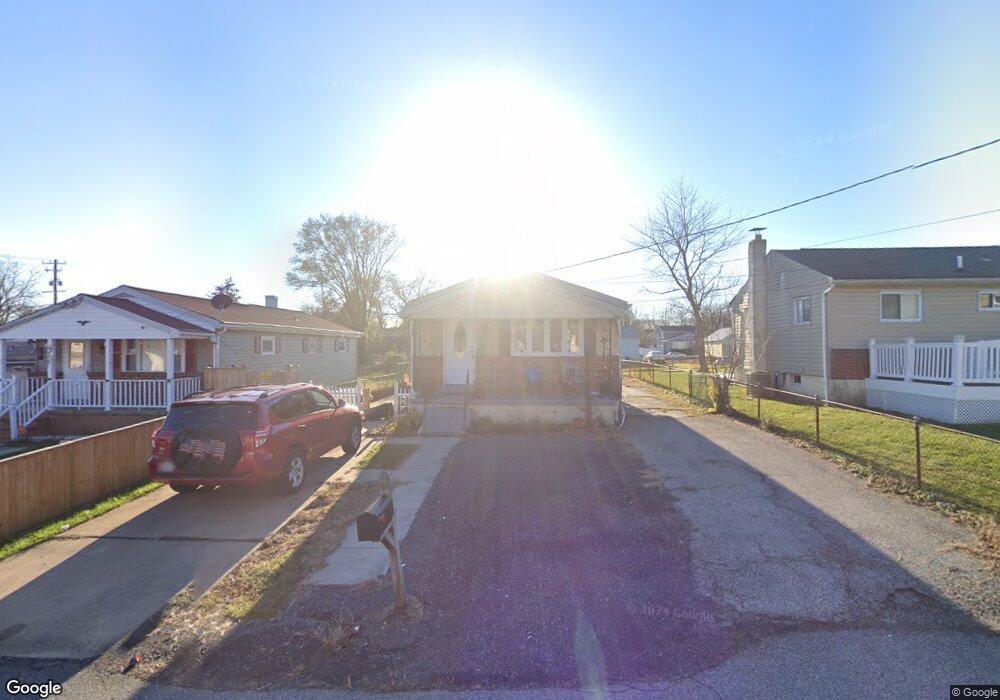
5903 Cecil Ave Gwynn Oak, MD 21207
Estimated Value: $236,000 - $280,000
2
Beds
1
Bath
760
Sq Ft
$336/Sq Ft
Est. Value
About This Home
This home is located at 5903 Cecil Ave, Gwynn Oak, MD 21207 and is currently estimated at $255,600, approximately $336 per square foot. 5903 Cecil Ave is a home located in Baltimore County with nearby schools including Edmondson Heights Elementary School, Southwest Academy, and Woodlawn High School.
Ownership History
Date
Name
Owned For
Owner Type
Purchase Details
Closed on
Oct 17, 2011
Sold by
Mathias John Wayne and Mathias John Wayne
Bought by
Dimass Reina Dimas and Dimas Reina Dimas
Current Estimated Value
Home Financials for this Owner
Home Financials are based on the most recent Mortgage that was taken out on this home.
Original Mortgage
$116,958
Outstanding Balance
$80,345
Interest Rate
4.25%
Mortgage Type
FHA
Estimated Equity
$175,255
Purchase Details
Closed on
Sep 30, 2011
Sold by
Mathias John Wayne and Mathias John Wayne
Bought by
Dimass Reina Dimas and Dimas Reina Dimas
Home Financials for this Owner
Home Financials are based on the most recent Mortgage that was taken out on this home.
Original Mortgage
$116,958
Outstanding Balance
$80,345
Interest Rate
4.25%
Mortgage Type
FHA
Estimated Equity
$175,255
Purchase Details
Closed on
Aug 28, 1970
Sold by
Mathias Barbara
Bought by
Mathias John Wayne
Create a Home Valuation Report for This Property
The Home Valuation Report is an in-depth analysis detailing your home's value as well as a comparison with similar homes in the area
Home Values in the Area
Average Home Value in this Area
Purchase History
| Date | Buyer | Sale Price | Title Company |
|---|---|---|---|
| Dimass Reina Dimas | $120,000 | -- | |
| Dimass Reina Dimas | $120,000 | -- | |
| Mathias John Wayne | $12,000 | -- |
Source: Public Records
Mortgage History
| Date | Status | Borrower | Loan Amount |
|---|---|---|---|
| Open | Dimass Reina Dimas | $116,958 | |
| Closed | Dimass Reina Dimas | $116,958 |
Source: Public Records
Tax History Compared to Growth
Tax History
| Year | Tax Paid | Tax Assessment Tax Assessment Total Assessment is a certain percentage of the fair market value that is determined by local assessors to be the total taxable value of land and additions on the property. | Land | Improvement |
|---|---|---|---|---|
| 2025 | $3,086 | $187,700 | -- | -- |
| 2024 | $3,086 | $181,100 | $69,000 | $112,100 |
| 2023 | $1,551 | $168,200 | $0 | $0 |
| 2022 | $2,868 | $155,300 | $0 | $0 |
| 2021 | $2,545 | $142,400 | $69,000 | $73,400 |
| 2020 | $2,545 | $138,967 | $0 | $0 |
| 2019 | $2,530 | $135,533 | $0 | $0 |
| 2018 | $2,389 | $132,100 | $67,000 | $65,100 |
| 2017 | $2,206 | $126,433 | $0 | $0 |
| 2016 | $1,846 | $120,767 | $0 | $0 |
| 2015 | $1,846 | $115,100 | $0 | $0 |
| 2014 | $1,846 | $115,100 | $0 | $0 |
Source: Public Records
Map
Nearby Homes
- 1228 Harwall Rd
- 5904 Cecil Ave
- 5901 Sunset Ave
- 1427 Barrett Rd
- 1428 Clairidge Rd
- 1525 Clairidge Rd
- 1405 Ingleside Ave
- 1529 Clairidge Rd
- 5922 Baltimore St
- 5902 Prince George St
- 5936 Sunset Ave
- 1204 Wilson Ave
- 5911 Carroll St
- 1171 Granville Rd
- 1603 N Forest Park Ave
- 1191 Granville Rd
- 1120 Ingleside Ave
- 6041 Cecil Ave
- 1230 Stamford Rd
- 1124 Brigadoon Trail
- 5901 Cecil Ave
- 5905 Cecil Ave
- 5907 Cecil Ave
- 1416 Ingleside Ave
- 1414 Ingleside Ave
- 5904 Harford Ave
- 5909 Cecil Ave
- 5908 Harford Ave
- 1412 Ingleside Ave
- 5900 Cecil Ave
- 5902 Cecil Ave
- 1418 Ingleside Ave
- 1410 Ingleside Ave
- 5906 Cecil Ave
- 5912 Harford Ave
- 1420 Ingleside Ave Unit A
- 1420 Ingleside Ave
- 5913 Cecil Ave
- 5908 Cecil Ave
- 1408 Ingleside Ave