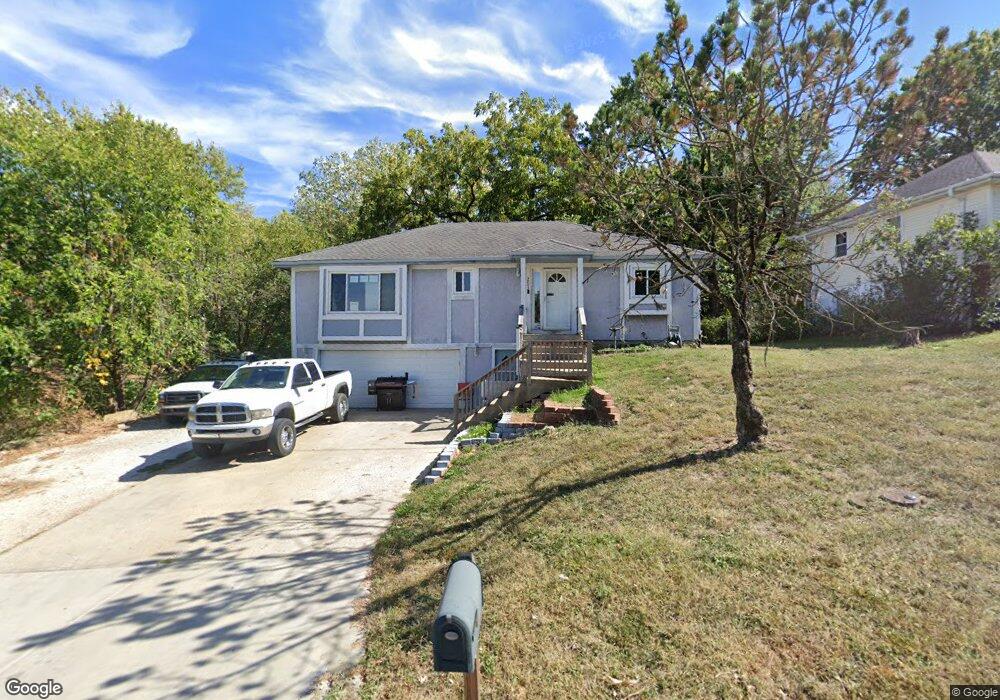
5903 Noland Rd Shawnee, KS 66216
Estimated Value: $347,263 - $399,000
3
Beds
3
Baths
1,990
Sq Ft
$186/Sq Ft
Est. Value
About This Home
This home is located at 5903 Noland Rd, Shawnee, KS 66216 and is currently estimated at $370,816, approximately $186 per square foot. 5903 Noland Rd is a home located in Johnson County with nearby schools including Ray Marsh Elementary School, Trailridge Middle School, and Shawnee Mission Northwest High School.
Ownership History
Date
Name
Owned For
Owner Type
Purchase Details
Closed on
Oct 11, 2011
Sold by
Secretary Of Housing & Urban Development
Bought by
House Ii Mark R
Current Estimated Value
Home Financials for this Owner
Home Financials are based on the most recent Mortgage that was taken out on this home.
Original Mortgage
$105,262
Interest Rate
4.15%
Mortgage Type
FHA
Purchase Details
Closed on
Mar 22, 2011
Sold by
Henry Lisa E and Henry Justin M
Bought by
The Secretary Of Housing & Urban Develop
Purchase Details
Closed on
Jun 18, 2009
Sold by
Henry Lisa E and Henry Justin M
Bought by
The Henry Family Trust
Purchase Details
Closed on
Oct 11, 2006
Sold by
Watch Tower Bible
Bought by
Henry Lisa
Home Financials for this Owner
Home Financials are based on the most recent Mortgage that was taken out on this home.
Original Mortgage
$177,500
Interest Rate
6.46%
Mortgage Type
New Conventional
Purchase Details
Closed on
Apr 25, 2006
Sold by
Martin Donna M
Bought by
Martin Donna M and Johnson Donna M
Create a Home Valuation Report for This Property
The Home Valuation Report is an in-depth analysis detailing your home's value as well as a comparison with similar homes in the area
Home Values in the Area
Average Home Value in this Area
Purchase History
| Date | Buyer | Sale Price | Title Company |
|---|---|---|---|
| House Ii Mark R | -- | American Title Group | |
| The Secretary Of Housing & Urban Develop | $232,099 | Continental Title | |
| The Henry Family Trust | -- | None Available | |
| Henry Lisa | -- | Chicago Title Ins Co | |
| Martin Donna M | -- | None Available |
Source: Public Records
Mortgage History
| Date | Status | Borrower | Loan Amount |
|---|---|---|---|
| Previous Owner | House Ii Mark R | $105,262 | |
| Previous Owner | Henry Lisa | $177,500 |
Source: Public Records
Tax History
| Year | Tax Paid | Tax Assessment Tax Assessment Total Assessment is a certain percentage of the fair market value that is determined by local assessors to be the total taxable value of land and additions on the property. | Land | Improvement |
|---|---|---|---|---|
| 2025 | $3,994 | $36,915 | $6,095 | $30,820 |
| 2024 | $3,994 | $37,800 | $5,545 | $32,255 |
| 2023 | $3,873 | $36,133 | $5,283 | $30,850 |
| 2022 | $3,178 | $29,567 | $4,799 | $24,768 |
| 2021 | $2,878 | $25,047 | $4,367 | $20,680 |
| 2020 | $2,599 | $22,310 | $3,976 | $18,334 |
| 2019 | $2,500 | $21,436 | $3,610 | $17,826 |
| 2018 | $2,328 | $19,872 | $3,610 | $16,262 |
| 2017 | $2,268 | $19,056 | $3,143 | $15,913 |
| 2016 | $2,191 | $18,170 | $3,143 | $15,027 |
| 2015 | $1,903 | $16,468 | $3,143 | $13,325 |
| 2013 | -- | $14,835 | $3,143 | $11,692 |
Source: Public Records
Map
Nearby Homes
- 5751 Richards Cir
- 6127, 6129 and lot Pflumm Rd
- 5828 Park Cir
- 13721 W 58th Terrace Unit 1
- 13821 W 58th Terrace Unit 1
- 13825 W 58th Terrace Unit 6
- 6145 Park St
- 5711 Westgate St
- 13216 W 55th Terrace
- 5703 Cottonwood St
- 5627 Long Ave
- 5702 Halsey St
- 12000 W 60th Place
- 5916 Albervan St
- 11903 W 58th Terrace Unit H
- 6528 Bradshaw St
- 5519 Monrovia St
- 14116 W 56th Ct
- 14208 W 63rd St
- 6340 Hallet St
- 5905 Noland Rd
- 13021 Johnson Dr
- 5902 Noland Rd
- 5911 Noland Rd
- 5906 Noland Rd
- 13011 Johnson Dr
- 13207 Johnson Dr
- 13001 Johnson Dr
- 5913 Noland Rd
- 5908 Hauser Dr
- 5926 W Richards Dr
- 13213 Johnson Dr
- 5912 Noland Rd
- 5818 Noland Rd
- 5917 Noland Rd
- 5921 W Richards Dr
- 5910 Hauser Dr
- 5909 Hauser Dr
- 5930 W Richards Dr
Your Personal Tour Guide
Ask me questions while you tour the home.