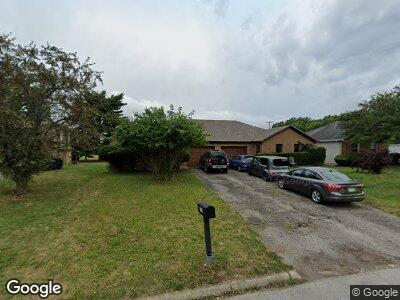
5903 Saranac Dr Unit 905 Columbus, OH 43232
Walnut Hills NeighborhoodEstimated Value: $283,000 - $355,000
4
Beds
2
Baths
2,228
Sq Ft
$140/Sq Ft
Est. Value
About This Home
This home is located at 5903 Saranac Dr Unit 905, Columbus, OH 43232 and is currently estimated at $312,569, approximately $140 per square foot. 5903 Saranac Dr Unit 905 is a home located in Franklin County with nearby schools including Oakmont Elementary School, Yorktown Middle School, and Independence High School.
Ownership History
Date
Name
Owned For
Owner Type
Purchase Details
Closed on
Mar 8, 2016
Sold by
Killilea Terrance
Bought by
Om Investments Llc
Current Estimated Value
Purchase Details
Closed on
Jan 17, 2003
Sold by
Djalatta Loretta J
Bought by
Killilea Terrance
Home Financials for this Owner
Home Financials are based on the most recent Mortgage that was taken out on this home.
Original Mortgage
$117,250
Interest Rate
6.07%
Mortgage Type
Unknown
Purchase Details
Closed on
Dec 24, 1998
Sold by
Berger John R and Berger Joan M
Bought by
Djalatta Loretta J
Home Financials for this Owner
Home Financials are based on the most recent Mortgage that was taken out on this home.
Original Mortgage
$100,000
Interest Rate
6.79%
Purchase Details
Closed on
Dec 20, 1985
Bought by
Berger John R
Purchase Details
Closed on
Mar 1, 1985
Create a Home Valuation Report for This Property
The Home Valuation Report is an in-depth analysis detailing your home's value as well as a comparison with similar homes in the area
Home Values in the Area
Average Home Value in this Area
Purchase History
| Date | Buyer | Sale Price | Title Company |
|---|---|---|---|
| Om Investments Llc | $85,000 | None Available | |
| Killilea Terrance | $167,500 | Foundation Title Agency Inc | |
| Djalatta Loretta J | $136,000 | -- | |
| Berger John R | $94,200 | -- | |
| -- | $50,000 | -- |
Source: Public Records
Mortgage History
| Date | Status | Borrower | Loan Amount |
|---|---|---|---|
| Open | Om Investments Llc | $71,600 | |
| Previous Owner | Killilea Terrance | $148,000 | |
| Previous Owner | Killilea Terrance | $47,000 | |
| Previous Owner | Killilea Terrance J | $117,250 | |
| Previous Owner | Djalatta Loretta J | $100,000 |
Source: Public Records
Tax History Compared to Growth
Tax History
| Year | Tax Paid | Tax Assessment Tax Assessment Total Assessment is a certain percentage of the fair market value that is determined by local assessors to be the total taxable value of land and additions on the property. | Land | Improvement |
|---|---|---|---|---|
| 2024 | $3,672 | $80,120 | $24,260 | $55,860 |
| 2023 | $3,626 | $80,115 | $24,255 | $55,860 |
| 2022 | $2,476 | $46,590 | $21,140 | $25,450 |
| 2021 | $2,480 | $46,590 | $21,140 | $25,450 |
| 2020 | $2,484 | $46,590 | $21,140 | $25,450 |
| 2019 | $2,518 | $40,500 | $18,380 | $22,120 |
| 2018 | $1,257 | $40,500 | $18,380 | $22,120 |
| 2017 | $3,117 | $40,500 | $18,380 | $22,120 |
| 2016 | $3,389 | $49,880 | $7,950 | $41,930 |
| 2015 | $1,543 | $49,880 | $7,950 | $41,930 |
| 2014 | $3,093 | $49,880 | $7,950 | $41,930 |
| 2013 | $1,606 | $52,500 | $8,365 | $44,135 |
Source: Public Records
Map
Nearby Homes
- 0 Brice Rd
- 2069 Walnut Hill Park Dr
- 5904 Hallworth Ave Unit B
- 5596 Autumn Chase Dr
- 5840 Hallridge Cir Unit A
- 5775 Corinne Creek Dr
- 5531 Worcester Dr Unit 533
- 6350 Roselawn Ave
- 1835 Woodette Rd
- 1387 Orchard Park Dr
- 5337 Ivyhurst Dr
- 1223 Idlewild Dr
- 6541 Santa Cruz Place Unit 6541
- 1778 Orlando Rd
- 6555 Birchview Dr N
- 1924 Alsace Rd
- 1624 Coppertree Ln
- 2160 Baldwin Rd Unit 162
- 0 E Livingston Ave
- 2680 Mellowbrook St
- 5903 Saranac Dr Unit 905
- 5903-5905 Saranac Dr Unit 2
- 5895 Saranac Dr
- 5917 Saranac Dr Unit 919
- 5883 Saranac Dr Unit 885
- 5923 Saranac Dr
- 5925 Saranac Dr Unit 927
- 5900-5902 Saranac Dr
- 5900-5902 Saranac Dr Unit 902
- 5900 Saranac Dr Unit 902
- 5916 Saranac Dr Unit 918
- 1851-1853 Lake Club Dr
- 1851 Lake Club Dr Unit 853
- 5930 Saranac Dr Unit 932
- 5880-5882 Saranac Dr
- 5880 Saranac Dr Unit 882
- 5880 Saranac Dr Unit 82
- 5942 Saranac Dr Unit 944
- 5868 Saranac Dr Unit 870
- 5850 Saranac Dr