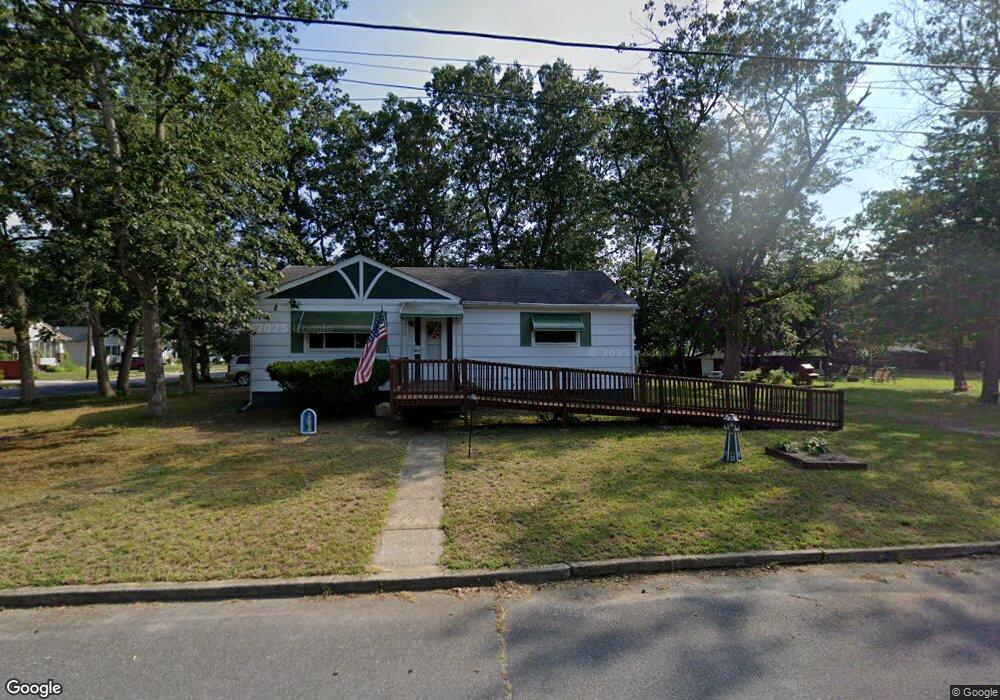
5904 7th St Mays Landing, NJ 08330
Estimated Value: $250,826 - $302,000
--
Bed
--
Bath
960
Sq Ft
$290/Sq Ft
Est. Value
About This Home
This home is located at 5904 7th St, Mays Landing, NJ 08330 and is currently estimated at $278,457, approximately $290 per square foot. 5904 7th St is a home located in Atlantic County with nearby schools including Joseph Shaner School, George L. Hess Educational Complex, and William Davies Middle School.
Ownership History
Date
Name
Owned For
Owner Type
Purchase Details
Closed on
Nov 20, 2019
Sold by
Mattera Patrick J and Estate Of Lucy Mattera
Bought by
Sarachene John C
Current Estimated Value
Home Financials for this Owner
Home Financials are based on the most recent Mortgage that was taken out on this home.
Original Mortgage
$117,500
Outstanding Balance
$103,677
Interest Rate
3.75%
Mortgage Type
New Conventional
Estimated Equity
$174,781
Purchase Details
Closed on
Jul 16, 1963
Bought by
Mattera Aniello and Mattera Lucy
Create a Home Valuation Report for This Property
The Home Valuation Report is an in-depth analysis detailing your home's value as well as a comparison with similar homes in the area
Home Values in the Area
Average Home Value in this Area
Purchase History
| Date | Buyer | Sale Price | Title Company |
|---|---|---|---|
| Sarachene John C | $157,500 | Surety Title Company | |
| Mattera Aniello | -- | -- |
Source: Public Records
Mortgage History
| Date | Status | Borrower | Loan Amount |
|---|---|---|---|
| Open | Sarachene John C | $117,500 |
Source: Public Records
Tax History Compared to Growth
Tax History
| Year | Tax Paid | Tax Assessment Tax Assessment Total Assessment is a certain percentage of the fair market value that is determined by local assessors to be the total taxable value of land and additions on the property. | Land | Improvement |
|---|---|---|---|---|
| 2025 | $5,040 | $146,900 | $47,000 | $99,900 |
| 2024 | $5,040 | $146,900 | $47,000 | $99,900 |
| 2023 | $4,739 | $146,900 | $47,000 | $99,900 |
| 2022 | $4,739 | $146,900 | $47,000 | $99,900 |
| 2021 | $4,729 | $146,900 | $47,000 | $99,900 |
| 2020 | $4,479 | $146,900 | $47,000 | $99,900 |
| 2019 | $4,490 | $146,900 | $47,000 | $99,900 |
| 2018 | $4,324 | $146,900 | $47,000 | $99,900 |
| 2017 | $4,252 | $146,900 | $47,000 | $99,900 |
| 2016 | $4,126 | $146,900 | $47,000 | $99,900 |
| 2015 | $3,978 | $146,900 | $47,000 | $99,900 |
| 2014 | $4,040 | $163,300 | $55,800 | $107,500 |
Source: Public Records
Map
Nearby Homes
- 717 Route 50
- 0 3rd St
- 526 Bainbridge Ave
- 5745 2nd St
- Rt 50 and Old Mays Landing Rd
- 535 Park Rd
- 22 Ernst Ct
- 565 Park Rd
- 0 Cape May Ave
- 42 Ernst Ct
- 1st First Ave
- Lot:11.02-12.02 Estelle Ave
- B:534 L:11.01 Estelle Ave
- B:534 L:12.02 Estelle Ave
- B:534 L:11.02 Estelle Ave
- 504 Meadowbrook Dr
- Bl 531 Lot 8&9 Adams Ave
- 225 Old River Rd
- 80 Mill St
- 246 Old River Rd