Estimated Value: $900,683 - $950,000
4
Beds
4
Baths
2,176
Sq Ft
$425/Sq Ft
Est. Value
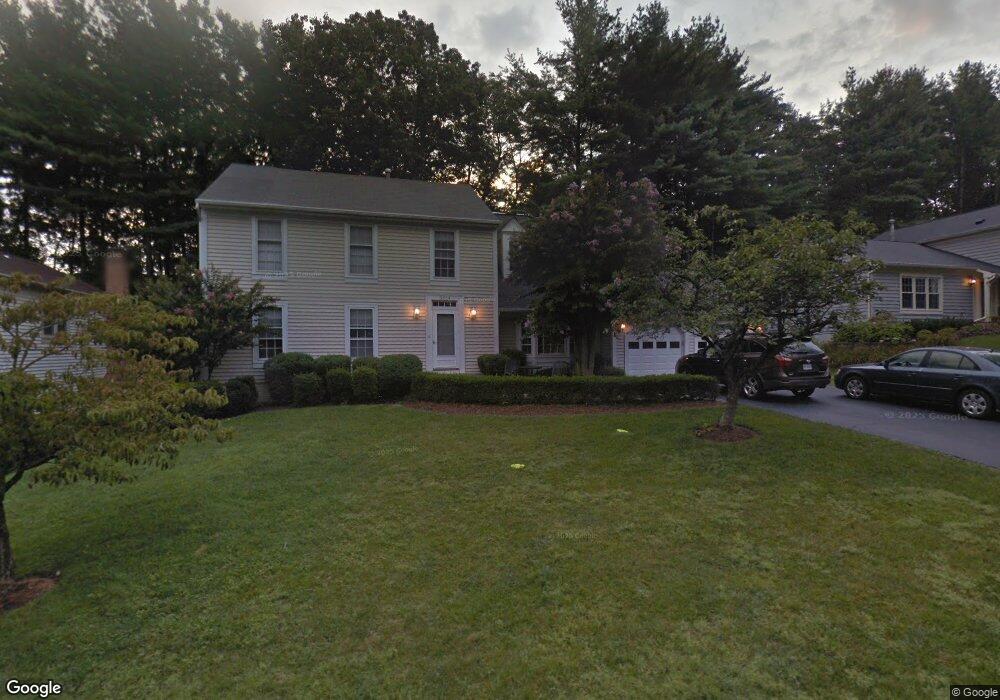
About This Home
This home is located at 5904 Burnside Landing Dr, Burke, VA 22015 and is currently estimated at $924,921, approximately $425 per square foot. 5904 Burnside Landing Dr is a home located in Fairfax County with nearby schools including Fairview Elementary School, James W Robinson, Jr. Secondary School, and Fairfax Baptist Temple Academy.
Ownership History
Date
Name
Owned For
Owner Type
Purchase Details
Closed on
Apr 30, 2018
Sold by
Iselin Steven R and Iselin Tamara Lee
Bought by
Riehman Kenneth and Riehman Melissa
Current Estimated Value
Home Financials for this Owner
Home Financials are based on the most recent Mortgage that was taken out on this home.
Original Mortgage
$572,062
Outstanding Balance
$493,018
Interest Rate
4.44%
Mortgage Type
VA
Estimated Equity
$431,903
Purchase Details
Closed on
Jul 25, 1997
Sold by
Rekart John L and Rekart Dian K
Bought by
Iselin Steven R and Iselin Tamara L
Home Financials for this Owner
Home Financials are based on the most recent Mortgage that was taken out on this home.
Original Mortgage
$201,600
Interest Rate
7.7%
Mortgage Type
New Conventional
Create a Home Valuation Report for This Property
The Home Valuation Report is an in-depth analysis detailing your home's value as well as a comparison with similar homes in the area
Home Values in the Area
Average Home Value in this Area
Purchase History
| Date | Buyer | Sale Price | Title Company |
|---|---|---|---|
| Riehman Kenneth | $640,000 | Commonwealth Land Title | |
| Iselin Steven R | $252,000 | -- |
Source: Public Records
Mortgage History
| Date | Status | Borrower | Loan Amount |
|---|---|---|---|
| Open | Riehman Kenneth | $572,062 | |
| Previous Owner | Iselin Steven R | $201,600 |
Source: Public Records
Tax History Compared to Growth
Tax History
| Year | Tax Paid | Tax Assessment Tax Assessment Total Assessment is a certain percentage of the fair market value that is determined by local assessors to be the total taxable value of land and additions on the property. | Land | Improvement |
|---|---|---|---|---|
| 2025 | $9,266 | $828,270 | $319,000 | $509,270 |
| 2024 | $9,266 | $799,790 | $309,000 | $490,790 |
| 2023 | $9,126 | $808,720 | $309,000 | $499,720 |
| 2022 | $8,579 | $750,230 | $309,000 | $441,230 |
| 2021 | $7,798 | $664,500 | $254,000 | $410,500 |
| 2020 | $7,501 | $633,790 | $249,000 | $384,790 |
| 2019 | $7,203 | $608,630 | $244,000 | $364,630 |
| 2018 | $6,869 | $597,340 | $244,000 | $353,340 |
| 2017 | $6,604 | $568,840 | $219,000 | $349,840 |
| 2016 | $6,894 | $595,070 | $219,000 | $376,070 |
| 2015 | $6,641 | $595,070 | $219,000 | $376,070 |
| 2014 | $6,371 | $572,160 | $214,000 | $358,160 |
Source: Public Records
Map
Nearby Homes
- 5918 Cove Landing Rd Unit 204
- 5924 Cove Landing Rd Unit 301
- 10679 Spring Oak Ct
- 5816 Oak Leather Dr
- 5932 Cove Landing Rd Unit 101
- 5837 Cove Landing Rd Unit 101
- 5806 Cove Landing Rd Unit 304
- 5806 Cove Landing Rd Unit 101
- 10676 Myrtle Oak Ct
- 10636 Alison Dr
- 5674 Oak Tanager Ct
- 6115 Martins Landing Ct
- 5879 Jacksons Oak Ct
- 10731 Bear Oak Ct
- 5703 Oak Stake Ct
- 10330 Luria Commons Ct Unit 1B
- 10310 Bridgetown Place Unit 56
- 10356 Bridgetown Place Unit 135
- 10411 Todman Landing Ct
- 5713 Oak Green Way
- 5906 Burnside Landing Dr
- 5902 Burnside Landing Dr
- 5914 Burnside Landing Dr
- 5908 Burnside Landing Dr
- 5912 Burnside Landing Dr
- 5916 Burnside Landing Dr
- 5910 Burnside Landing Dr
- 5898 Burnside Landing Dr
- 5918 Burnside Landing Dr
- 5920 Burnside Landing Dr
- 5970 Ohara Landing Ct
- 5896 Burnside Landing Dr
- 5963 Ohara Landing Ct
- 5968 Ohara Landing Ct
- 5966 Ohara Landing Ct
- 5929 Waters Edge Landing Ln
- 5961 Ohara Landing Ct
- 5922 Burnside Landing Dr
- 6499 O'Hara Landing Ct
- 5927 Waters Edge Landing Ln