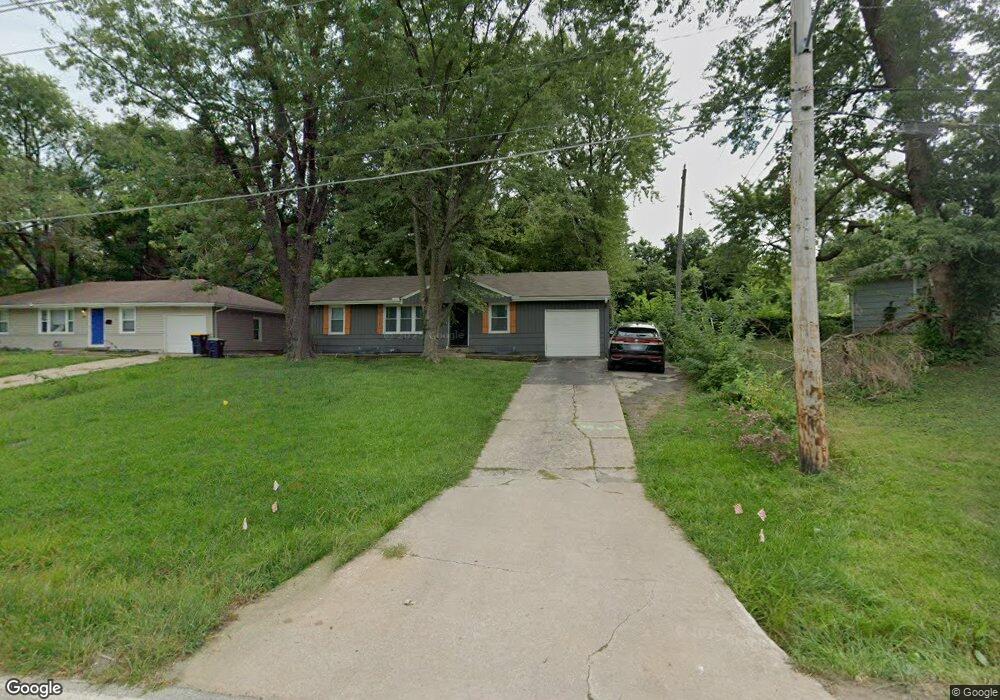
5905 E 99th St Kansas City, MO 64134
Fairlane NeighborhoodEstimated Value: $161,000 - $175,545
3
Beds
1
Bath
936
Sq Ft
$182/Sq Ft
Est. Value
About This Home
This home is located at 5905 E 99th St, Kansas City, MO 64134 and is currently estimated at $169,886, approximately $181 per square foot. 5905 E 99th St is a home located in Jackson County with nearby schools including Truman Elementary School, Islamic School of Greater Kansas City, and This Christian School.
Ownership History
Date
Name
Owned For
Owner Type
Purchase Details
Closed on
Mar 2, 2020
Sold by
Mekala Rakesh Reddy
Bought by
Mmr Realty Of Missouri Llc
Current Estimated Value
Home Financials for this Owner
Home Financials are based on the most recent Mortgage that was taken out on this home.
Original Mortgage
$96,000
Interest Rate
3.7%
Mortgage Type
New Conventional
Purchase Details
Closed on
Jan 24, 2020
Sold by
1 Big Red Llc
Bought by
Mekala Rakesh Reddy
Home Financials for this Owner
Home Financials are based on the most recent Mortgage that was taken out on this home.
Original Mortgage
$96,000
Interest Rate
3.7%
Mortgage Type
New Conventional
Purchase Details
Closed on
Oct 21, 2019
Sold by
Mcbride Wilmer E
Bought by
1 Big Red Llc
Purchase Details
Closed on
May 31, 2001
Sold by
Overcast Maxine
Bought by
Mcbride Wilmer E
Home Financials for this Owner
Home Financials are based on the most recent Mortgage that was taken out on this home.
Original Mortgage
$62,006
Interest Rate
7.1%
Mortgage Type
FHA
Create a Home Valuation Report for This Property
The Home Valuation Report is an in-depth analysis detailing your home's value as well as a comparison with similar homes in the area
Home Values in the Area
Average Home Value in this Area
Purchase History
| Date | Buyer | Sale Price | Title Company |
|---|---|---|---|
| Mmr Realty Of Missouri Llc | -- | None Available | |
| Mekala Rakesh Reddy | -- | None Available | |
| 1 Big Red Llc | -- | None Available | |
| Mcbride Wilmer E | -- | Heart Of America Title Inc |
Source: Public Records
Mortgage History
| Date | Status | Borrower | Loan Amount |
|---|---|---|---|
| Previous Owner | Mekala Rakesh Reddy | $96,000 | |
| Previous Owner | Mcbride Wilmer E | $62,006 |
Source: Public Records
Tax History Compared to Growth
Tax History
| Year | Tax Paid | Tax Assessment Tax Assessment Total Assessment is a certain percentage of the fair market value that is determined by local assessors to be the total taxable value of land and additions on the property. | Land | Improvement |
|---|---|---|---|---|
| 2025 | $2,270 | $17,338 | $2,113 | $15,225 |
| 2024 | $2,229 | $26,220 | $3,464 | $22,756 |
| 2023 | $2,229 | $26,220 | $3,762 | $22,458 |
| 2022 | $1,298 | $13,110 | $2,537 | $10,573 |
| 2021 | $1,120 | $13,110 | $2,537 | $10,573 |
| 2020 | $1,127 | $12,476 | $2,537 | $9,939 |
| 2019 | $1,066 | $12,476 | $2,537 | $9,939 |
| 2018 | $1,052 | $11,491 | $2,801 | $8,690 |
| 2017 | $1,052 | $11,491 | $2,801 | $8,690 |
| 2016 | $1,056 | $11,203 | $2,414 | $8,789 |
| 2014 | $1,024 | $10,984 | $2,367 | $8,617 |
Source: Public Records
Map
Nearby Homes
- 10002 Oakley Ave
- 6105 E 96th Terrace
- 10013 Belmont Ave
- 9629 Beacon Ave
- 10004 Drury Ave
- 10007 Hardesty Ave
- 5500 E 101st St
- 10014 Hardesty Ave
- 6302 E 102nd St
- 9806 Bennington Ave
- 10036 Bennington Ave
- 6000 E 95th Terrace
- 6606 E 100th Terrace
- 10200 Fremont Ave
- 6309 E 102nd Terrace
- 6902 E 98th Terrace
- 6703 E 96th Terrace
- 9712 Blue Ridge Blvd
- 10021 Blue Ridge Blvd
- 7200 E 102nd St
- 5907 E 99th St
- 9901 Bellaire Ave
- 5909 E 99th St
- 9905 Bellaire Ave
- 5836 E 99th St
- 5904 E 99th Terrace
- 5906 E 99th Terrace
- 9907 Bellaire Ave
- 5911 E 99th St
- 5832 E 99th St
- 5900 E 99th St
- 5908 E 99th Terrace
- 9900 Bellaire Ave
- 5828 E 99th St
- 9904 Bellaire Ave
- 6001 E 99th St
- 5910 E 99th Terrace
- 5904 E 99th St
- 5824 E 99th St
- 9906 Bellaire Ave