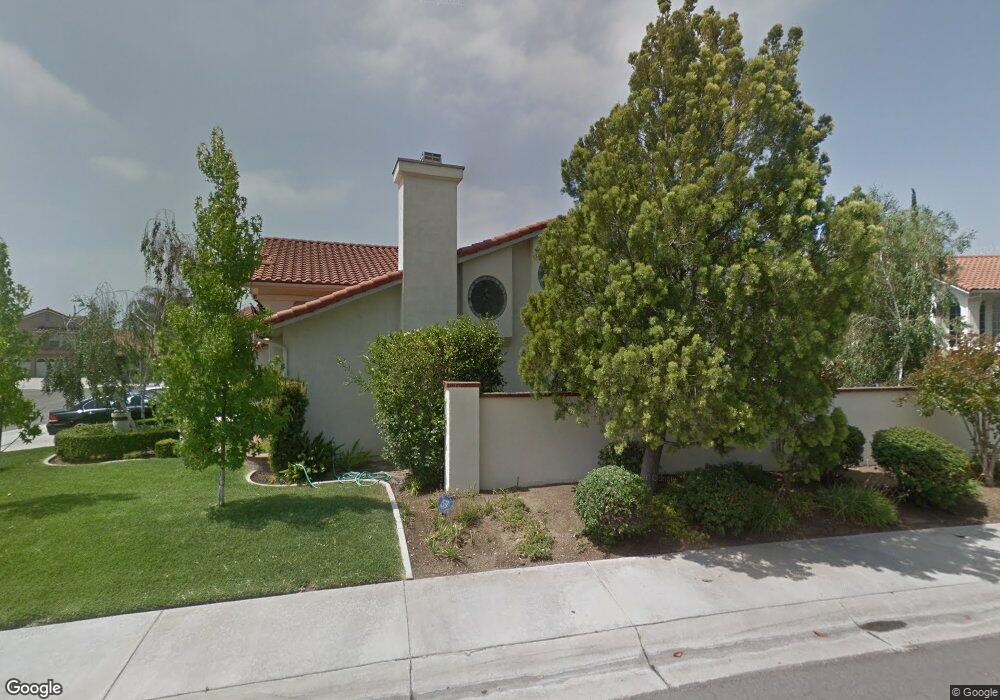
5905 Via Pasa Yorba Linda, CA 92887
Estimated Value: $1,939,000 - $2,254,000
4
Beds
3
Baths
3,850
Sq Ft
$549/Sq Ft
Est. Value
About This Home
This home is located at 5905 Via Pasa, Yorba Linda, CA 92887 and is currently estimated at $2,111,731, approximately $548 per square foot. 5905 Via Pasa is a home located in Orange County with nearby schools including Glenknoll Elementary, Bernardo Yorba Middle School, and Ivycrest Montessori Private School - Yorba Linda.
Ownership History
Date
Name
Owned For
Owner Type
Purchase Details
Closed on
May 3, 2004
Sold by
Wise William P and Wise Cristen K
Bought by
Renteria Alan R and Renteria Eva M
Current Estimated Value
Home Financials for this Owner
Home Financials are based on the most recent Mortgage that was taken out on this home.
Original Mortgage
$615,000
Outstanding Balance
$251,122
Interest Rate
3.68%
Mortgage Type
Negative Amortization
Estimated Equity
$1,860,609
Purchase Details
Closed on
Aug 7, 1996
Sold by
Prescott Wise William and Prescott Karen Cristen
Bought by
Wise William P and Wise Cristen K
Purchase Details
Closed on
May 10, 1993
Sold by
Upper K Shapell Joint Venture
Bought by
Wise William Prescott and Wise Cristen Karen
Home Financials for this Owner
Home Financials are based on the most recent Mortgage that was taken out on this home.
Original Mortgage
$408,400
Interest Rate
3.75%
Create a Home Valuation Report for This Property
The Home Valuation Report is an in-depth analysis detailing your home's value as well as a comparison with similar homes in the area
Home Values in the Area
Average Home Value in this Area
Purchase History
| Date | Buyer | Sale Price | Title Company |
|---|---|---|---|
| Renteria Alan R | $1,270,000 | Fidelity Title Company | |
| Wise William P | -- | -- | |
| Wise William Prescott | $510,500 | Chicago Title Co |
Source: Public Records
Mortgage History
| Date | Status | Borrower | Loan Amount |
|---|---|---|---|
| Open | Renteria Alan R | $615,000 | |
| Previous Owner | Wise William Prescott | $408,400 |
Source: Public Records
Tax History Compared to Growth
Tax History
| Year | Tax Paid | Tax Assessment Tax Assessment Total Assessment is a certain percentage of the fair market value that is determined by local assessors to be the total taxable value of land and additions on the property. | Land | Improvement |
|---|---|---|---|---|
| 2025 | $19,819 | $1,805,672 | $1,305,563 | $500,109 |
| 2024 | $19,819 | $1,730,000 | $1,279,964 | $450,036 |
| 2023 | $16,344 | $1,401,418 | $1,162,126 | $239,292 |
| 2022 | $16,158 | $1,373,940 | $1,139,340 | $234,600 |
| 2021 | $15,861 | $1,347,000 | $1,117,000 | $230,000 |
| 2020 | $13,216 | $1,100,000 | $870,000 | $230,000 |
| 2019 | $14,468 | $1,238,000 | $1,008,000 | $230,000 |
| 2018 | $12,712 | $1,070,000 | $840,000 | $230,000 |
| 2017 | $15,565 | $1,331,000 | $1,097,493 | $233,507 |
| 2016 | $11,816 | $994,945 | $761,438 | $233,507 |
| 2015 | $13,104 | $1,139,809 | $759,063 | $380,746 |
| 2014 | $12,958 | $1,139,809 | $759,063 | $380,746 |
Source: Public Records
Map
Nearby Homes
- 6305 Saint Francis Ct
- 6375 Tiburon Terrace
- 20065 Berkeley Way
- 20453 Elm Hill Ln Unit 26
- 20267 Clear River Ln Unit 7
- 19931 Crestknoll Dr
- 20520 Via Magdalena
- 6437 Horse Shoe Ln Unit 2
- 20415 Herbshey Cir
- 20180 Pingree Way
- 6473 Horse Shoe Ln Unit 6
- 6478 Horse Shoe Ln Unit 9
- 1290 N Tippetts Ln
- 19816 White Spring Ln Unit 36
- 6025 Kingsbriar Dr
- 20002 Wrightwood Ct Unit 31
- 5540 Via Sara
- 6821 Rocky Grove Ct Unit 13
- 6692 Palma Cir
- 6681 Palma Cir
- 5915 Via Pasa
- 5875 Vista Del Mar
- 4156 Via Pasado
- 4168 Via Pasado
- 5925 Via Pasa
- 5865 Vista Del Mar
- 5900 Via Pasa
- 5870 Vista Del Mar
- 5910 Via Pasa
- 5860 Vista Del Mar
- 5935 Via Pasa
- 5855 Vista Del Mar
- 5920 Via Pasa
- 5930 Via Pasa
- 20490 Via Torralba
- 20480 Via Torralba
- 5905 Vista Del Mar
- 5850 Vista Del Mar
- 5845 Vista Del Mar
- 20182 Canyon Dr