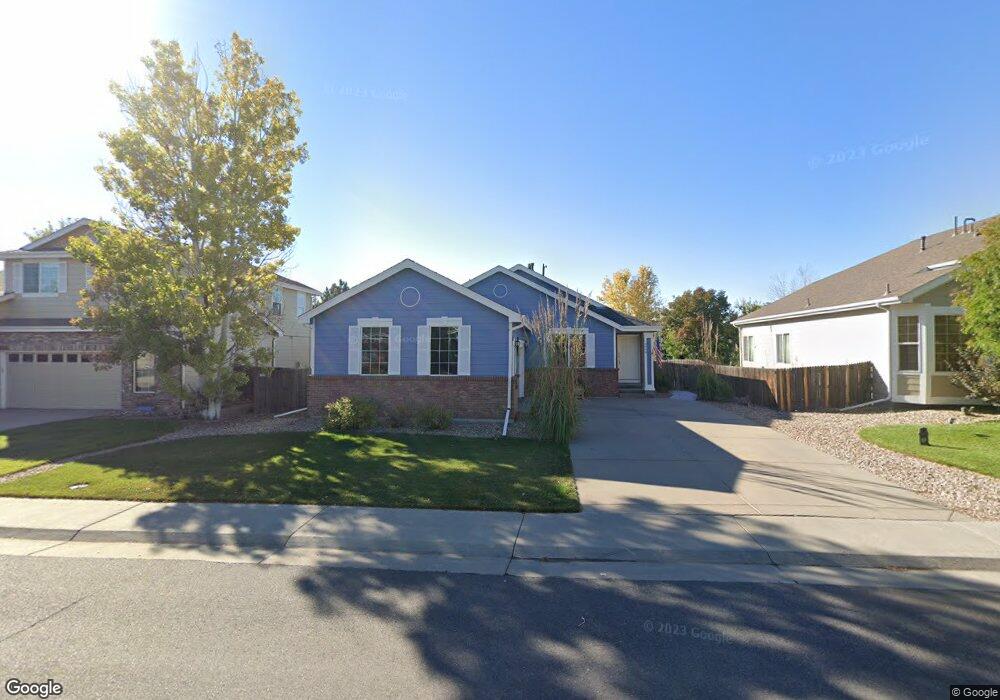
5906 E 129th Place Thornton, CO 80602
Riverdale Park NeighborhoodEstimated Value: $528,785 - $573,000
3
Beds
2
Baths
1,528
Sq Ft
$361/Sq Ft
Est. Value
About This Home
This home is located at 5906 E 129th Place, Thornton, CO 80602 and is currently estimated at $551,446, approximately $360 per square foot. 5906 E 129th Place is a home located in Adams County with nearby schools including West Ridge Elementary School, Shore Acres Elementary School, and Elderberry Elementary.
Ownership History
Date
Name
Owned For
Owner Type
Purchase Details
Closed on
Nov 22, 2022
Sold by
Orchard Property Iii Llc
Bought by
Cavaleri-Glennon Celia
Current Estimated Value
Purchase Details
Closed on
Aug 22, 2022
Sold by
Glasser Gary A
Bought by
Orchard Property Iii Llc
Purchase Details
Closed on
Mar 10, 2011
Sold by
Glasser Gary A and Fuentes Noelle M
Bought by
Glasser Gary A and Glasser Noelle F
Home Financials for this Owner
Home Financials are based on the most recent Mortgage that was taken out on this home.
Original Mortgage
$202,508
Interest Rate
4.75%
Mortgage Type
FHA
Purchase Details
Closed on
Mar 4, 2004
Sold by
Kdb Homes Inc
Bought by
Fuentes Noelle M and Glasser Gary A
Home Financials for this Owner
Home Financials are based on the most recent Mortgage that was taken out on this home.
Original Mortgage
$217,413
Interest Rate
5.68%
Mortgage Type
FHA
Create a Home Valuation Report for This Property
The Home Valuation Report is an in-depth analysis detailing your home's value as well as a comparison with similar homes in the area
Home Values in the Area
Average Home Value in this Area
Purchase History
| Date | Buyer | Sale Price | Title Company |
|---|---|---|---|
| Cavaleri-Glennon Celia | $535,000 | -- | |
| Orchard Property Iii Llc | $522,500 | None Listed On Document | |
| Glasser Gary A | -- | Land Title Guarantee Company | |
| Fuentes Noelle M | $220,899 | Fahtco |
Source: Public Records
Mortgage History
| Date | Status | Borrower | Loan Amount |
|---|---|---|---|
| Previous Owner | Glasser Gary A | $202,508 | |
| Previous Owner | Fuentes Noelle M | $217,413 |
Source: Public Records
Tax History Compared to Growth
Tax History
| Year | Tax Paid | Tax Assessment Tax Assessment Total Assessment is a certain percentage of the fair market value that is determined by local assessors to be the total taxable value of land and additions on the property. | Land | Improvement |
|---|---|---|---|---|
| 2024 | $3,331 | $33,320 | $7,190 | $26,130 |
| 2023 | $3,315 | $37,890 | $6,970 | $30,920 |
| 2022 | $2,653 | $27,050 | $7,160 | $19,890 |
| 2021 | $2,556 | $27,050 | $7,160 | $19,890 |
| 2020 | $2,381 | $26,300 | $7,360 | $18,940 |
| 2019 | $2,383 | $26,300 | $7,360 | $18,940 |
| 2018 | $2,037 | $22,470 | $6,840 | $15,630 |
| 2017 | $2,034 | $22,470 | $6,840 | $15,630 |
| 2016 | $1,774 | $19,520 | $4,460 | $15,060 |
| 2015 | $1,770 | $19,520 | $4,460 | $15,060 |
| 2014 | -- | $17,920 | $4,140 | $13,780 |
Source: Public Records
Map
Nearby Homes
- 15372 Jersey Ct
- 5628 Hudson Cir
- 5575 E 130th Dr
- 12812 Jasmine St Unit C
- 13068 Kearney St
- 12797 Ivy St
- 12792 Ivy St
- 12774 Jasmine Ct
- 12771 Jasmine Ct
- 12740 Jasmine St Unit F
- 13275 Holly St Unit F
- 13028 Grape Ct
- 12845 Jasmine Way
- 13243 Holly St Unit F
- 13271 Holly St Unit B
- 12741 Ivanhoe St
- 12926 Jasmine Ct
- 13234 Krameria St
- 12774 Leyden St Unit D
- 5341 E 129th Way
- 5896 E 129th Place
- 5936 E 129th Place
- 5866 E 129th Place
- 5966 E 129th Place
- 5903 E 129th Ave
- 5933 E 129th Ave
- 5893 E 129th Ave
- 5905 E 129th Place
- 5863 E 129th Ave
- 5963 E 129th Ave
- 5836 E 129th Place
- 5895 E 129th Place
- 5996 E 129th Place
- 5865 E 129th Place
- 5965 E 129th Place
- 5993 E 129th Ave
- 12920 Ivy St
- 5806 E 129th Place
- 5835 E 129th Place
- 5995 E 129th Place